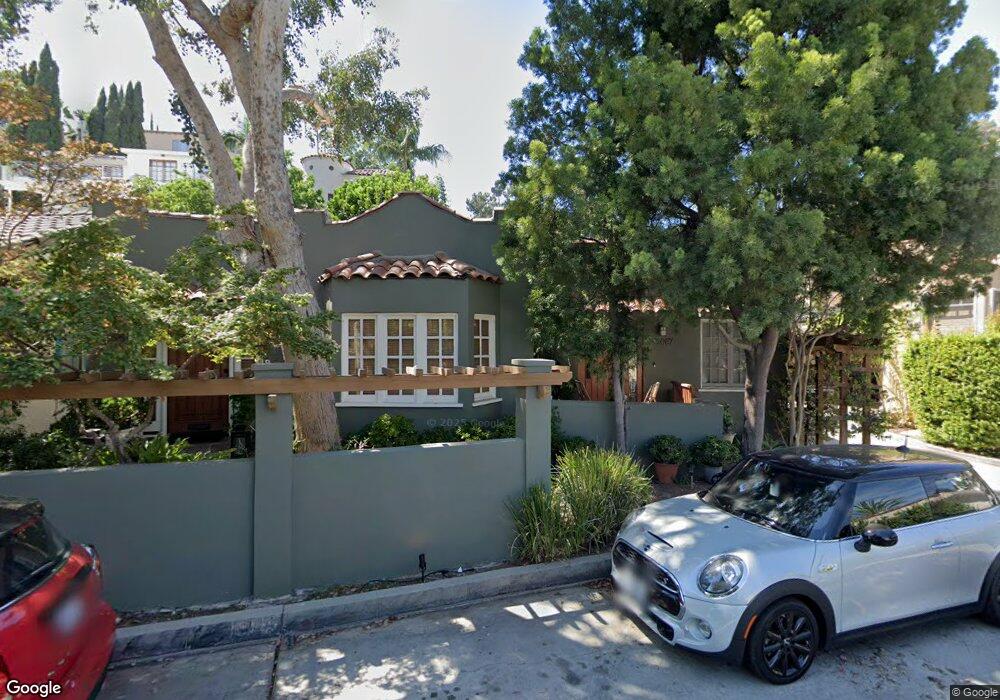
2065 High Tower Dr Los Angeles, CA 90068
Hollywood Hills NeighborhoodEstimated Value: $1,453,000 - $1,614,000
3
Beds
2
Baths
1,813
Sq Ft
$837/Sq Ft
Est. Value
About This Home
This home is located at 2065 High Tower Dr, Los Angeles, CA 90068 and is currently estimated at $1,517,238, approximately $836 per square foot. 2065 High Tower Dr is a home located in Los Angeles County with nearby schools including Gardner Street Elementary School, Hubert Howe Bancroft Middle School, and Hollywood Senior High School.
Ownership History
Date
Name
Owned For
Owner Type
Purchase Details
Closed on
Mar 12, 2004
Sold by
Colegrove Robert Wright
Bought by
Colegrove Robert Wright and Robert Wright Colegrove Jr Trust
Current Estimated Value
Purchase Details
Closed on
May 1, 2001
Sold by
Winterrowd Troy E
Bought by
Colegrove Robert Wright
Home Financials for this Owner
Home Financials are based on the most recent Mortgage that was taken out on this home.
Original Mortgage
$351,950
Outstanding Balance
$131,418
Interest Rate
7.03%
Estimated Equity
$1,385,820
Purchase Details
Closed on
Jan 25, 1999
Sold by
Mcclurg Edith M
Bought by
Winterrowd Troy E and Pickering James P
Home Financials for this Owner
Home Financials are based on the most recent Mortgage that was taken out on this home.
Original Mortgage
$244,000
Interest Rate
6.63%
Create a Home Valuation Report for This Property
The Home Valuation Report is an in-depth analysis detailing your home's value as well as a comparison with similar homes in the area
Home Values in the Area
Average Home Value in this Area
Purchase History
| Date | Buyer | Sale Price | Title Company |
|---|---|---|---|
| Colegrove Robert Wright | -- | -- | |
| Colegrove Robert Wright | $475,000 | Equity Title Company | |
| Winterrowd Troy E | $305,000 | Equity Title Company |
Source: Public Records
Mortgage History
| Date | Status | Borrower | Loan Amount |
|---|---|---|---|
| Open | Colegrove Robert Wright | $351,950 | |
| Previous Owner | Winterrowd Troy E | $244,000 |
Source: Public Records
Tax History Compared to Growth
Tax History
| Year | Tax Paid | Tax Assessment Tax Assessment Total Assessment is a certain percentage of the fair market value that is determined by local assessors to be the total taxable value of land and additions on the property. | Land | Improvement |
|---|---|---|---|---|
| 2025 | $8,866 | $715,731 | $565,058 | $150,673 |
| 2024 | $8,866 | $701,698 | $553,979 | $147,719 |
| 2023 | $8,702 | $687,940 | $543,117 | $144,823 |
| 2022 | $8,335 | $674,452 | $532,468 | $141,984 |
| 2021 | $8,228 | $661,228 | $522,028 | $139,200 |
| 2019 | $7,839 | $641,618 | $506,546 | $135,072 |
| 2018 | $7,762 | $629,038 | $496,614 | $132,424 |
| 2016 | $7,383 | $604,614 | $477,331 | $127,283 |
| 2015 | $7,275 | $595,534 | $470,162 | $125,372 |
| 2014 | $7,307 | $583,870 | $460,953 | $122,917 |
Source: Public Records
Map
Nearby Homes
- 2172 Broadview Terrace
- 6911 Camrose Dr
- 2060 High Tower Dr
- 6919 Camrose Dr
- 2041 Glencoe Way
- 2027 N Highland Ave
- 2002 Hillcrest Rd
- 7064 La Presa Dr
- 2200 Maravilla Dr
- 6930 Oporto Dr
- 1947 Glencoe Way
- 1940 N Highland Ave Unit 54
- 1940 N Highland Ave Unit 10
- 1940 N Highland Ave Unit 44
- 1940 N Highland Ave Unit 3
- 1940 N Highland Ave Unit 66
- 1940 N Highland Ave Unit 26
- 1919 Pinehurst Rd
- 6682 Whitley Terrace
- 7200 La Presa Dr
- 2059 High Tower Dr
- 2059 High Tower Dr
- 6860 Camrose Dr
- 2062 High Tower Dr
- 6862 Camrose Dr
- 6866 Camrose Dr
- 6868 Camrose Dr
- 2064 Glencoe Way
- 6858 Camrose Dr
- 2053 High Tower Dr
- 2068 Glencoe Way
- 2062 Glencoe Way Unit 2064
- 2062 Glencoe Way
- 2058 Glencoe Way
- 6870 Camrose Dr
- 6850 Camrose Dr
- 2066 Glencoe Way
- 2036 High Tower Dr
- 2047 High Tower Dr
- 2074 Glencoe Way