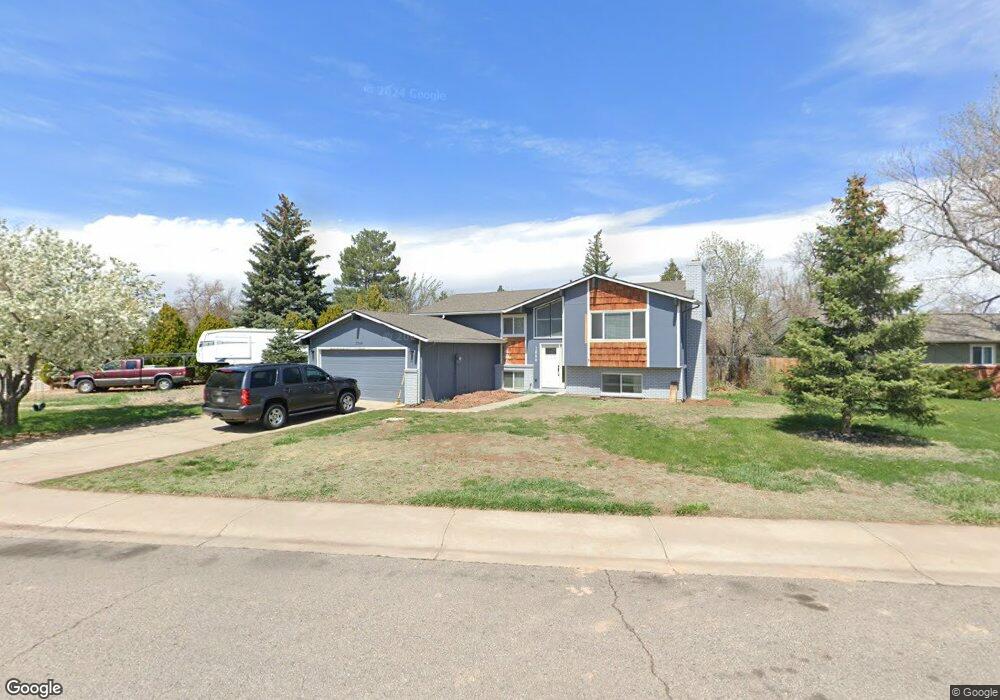
2066 Tunis Cir Fort Collins, CO 80526
Brown Farm NeighborhoodEstimated Value: $540,000 - $598,000
5
Beds
2
Baths
2,078
Sq Ft
$271/Sq Ft
Est. Value
About This Home
This home is located at 2066 Tunis Cir, Fort Collins, CO 80526 and is currently estimated at $562,899, approximately $270 per square foot. 2066 Tunis Cir is a home located in Larimer County with nearby schools including Bauder Elementary School, Blevins Middle School, and Rocky Mountain High School.
Ownership History
Date
Name
Owned For
Owner Type
Purchase Details
Closed on
Jun 25, 2014
Sold by
Bassi Vincent P
Bought by
Dougherty Patrick and Dougherty Pamela
Current Estimated Value
Home Financials for this Owner
Home Financials are based on the most recent Mortgage that was taken out on this home.
Original Mortgage
$192,449
Outstanding Balance
$148,016
Interest Rate
4.5%
Mortgage Type
FHA
Estimated Equity
$414,883
Purchase Details
Closed on
Dec 31, 2002
Sold by
Dennon Maryann and Mccoy Mary Ann
Bought by
Bassi Vincent P
Home Financials for this Owner
Home Financials are based on the most recent Mortgage that was taken out on this home.
Original Mortgage
$126,000
Interest Rate
5.96%
Purchase Details
Closed on
Sep 1, 1995
Sold by
Dennon Maryann
Bought by
Dennon Maryann
Purchase Details
Closed on
Feb 1, 1992
Sold by
Mccoy Steven D
Bought by
Mccoy Mary Ann
Create a Home Valuation Report for This Property
The Home Valuation Report is an in-depth analysis detailing your home's value as well as a comparison with similar homes in the area
Home Values in the Area
Average Home Value in this Area
Purchase History
| Date | Buyer | Sale Price | Title Company |
|---|---|---|---|
| Dougherty Patrick | $196,000 | Land Title Guarantee Company | |
| Bassi Vincent P | $163,500 | -- | |
| Dennon Maryann | -- | -- | |
| Mccoy Mary Ann | -- | -- |
Source: Public Records
Mortgage History
| Date | Status | Borrower | Loan Amount |
|---|---|---|---|
| Open | Dougherty Patrick | $192,449 | |
| Previous Owner | Bassi Vincent P | $126,000 |
Source: Public Records
Tax History Compared to Growth
Tax History
| Year | Tax Paid | Tax Assessment Tax Assessment Total Assessment is a certain percentage of the fair market value that is determined by local assessors to be the total taxable value of land and additions on the property. | Land | Improvement |
|---|---|---|---|---|
| 2025 | $3,204 | $37,078 | $2,680 | $34,398 |
| 2024 | $3,049 | $37,078 | $2,680 | $34,398 |
| 2022 | $2,487 | $26,341 | $2,780 | $23,561 |
| 2021 | $2,514 | $27,099 | $2,860 | $24,239 |
| 2020 | $2,760 | $29,501 | $2,860 | $26,641 |
| 2019 | $2,772 | $29,501 | $2,860 | $26,641 |
| 2018 | $2,101 | $23,054 | $2,880 | $20,174 |
| 2017 | $2,094 | $23,054 | $2,880 | $20,174 |
| 2016 | $1,676 | $18,356 | $3,184 | $15,172 |
| 2015 | $1,664 | $18,350 | $3,180 | $15,170 |
| 2014 | $1,512 | $16,570 | $3,180 | $13,390 |
Source: Public Records
Map
Nearby Homes
- 2407 Merino Ct
- 2449 W Stuart St
- 2167 Romney Ave
- 2206 Rambouillet Dr
- 2455 Wyandotte Dr
- 2929 Ross Dr Unit P46
- 1800 Rutledge Ct
- 2930 W Stuart St Unit 24
- 1955 Kingsborough Dr
- 2925 W Stuart St Unit 11
- 2960 W Stuart St Unit A304
- 3005 Ross Dr Unit T5
- 3005 Ross Dr Unit T6
- 2607 S Taft Hill Rd
- 3009 Knolls End Dr Unit 5
- 1943 Pecan St
- 1918 Ridgewood Rd
- 2420 Sheffield Cir E
- 1720 Azalea Ct
- 1507 Knotwood Ct
- 2048 Tunis Cir
- 2078 Tunis Cir
- 2036 Tunis Cir
- 2025 Hampshire Rd
- 2031 Hampshire Rd
- 2073 Tunis Cir
- 2079 Tunis Cir
- 2067 Tunis Cir
- 2055 Tunis Cir
- 2024 Tunis Cir
- 2061 Tunis Cir
- 2049 Tunis Cir
- 2101 Hampshire Rd
- 2019 Hampshire Rd
- 2412 Merino Ct
- 2037 Tunis Cir
- 2418 Merino Ct
- 2018 Tunis Cir
- 2400 Merino Ct
- 2031 Tunis Cir