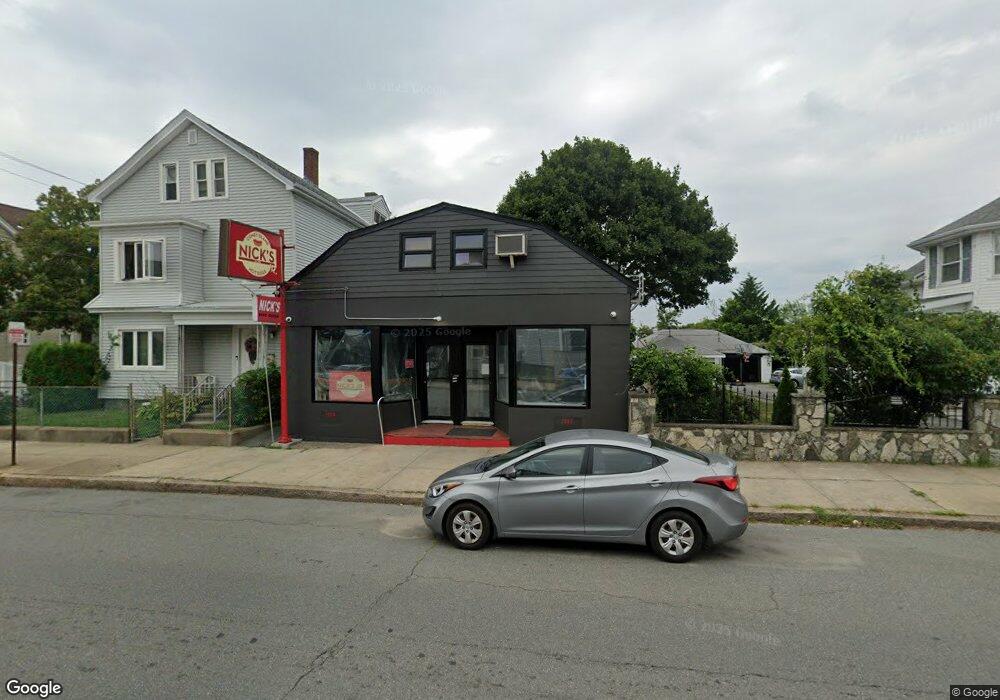
2067 S Main St Fall River, MA 02724
Sandy Beach NeighborhoodEstimated Value: $195,014
1
Bed
1
Bath
1,565
Sq Ft
$125/Sq Ft
Est. Value
About This Home
This home is located at 2067 S Main St, Fall River, MA 02724 and is currently estimated at $195,014, approximately $124 per square foot. 2067 S Main St is a home located in Bristol County with nearby schools including Carlton M. Viveiros Elementary School, Matthew J. Kuss Middle School, and B M C Durfee High School.
Ownership History
Date
Name
Owned For
Owner Type
Purchase Details
Closed on
Jul 24, 2017
Sold by
Lopes Scott
Bought by
A & E Lopes Realty Llc
Current Estimated Value
Purchase Details
Closed on
May 9, 2016
Sold by
Miner Raymond E and Miner Bernadette
Bought by
Lopes Scott
Purchase Details
Closed on
Oct 1, 1985
Bought by
Miner Raymond E and Miner Bernadette
Create a Home Valuation Report for This Property
The Home Valuation Report is an in-depth analysis detailing your home's value as well as a comparison with similar homes in the area
Home Values in the Area
Average Home Value in this Area
Purchase History
| Date | Buyer | Sale Price | Title Company |
|---|---|---|---|
| A & E Lopes Realty Llc | -- | -- | |
| A & E Lopes Realty Llc | -- | -- | |
| A & E Lopes Realty Llc | -- | -- | |
| Lopes Scott | $100,000 | -- | |
| Lopes Scott | $100,000 | -- | |
| Lopes Scott | $100,000 | -- | |
| Miner Raymond E | $22,800 | -- |
Source: Public Records
Mortgage History
| Date | Status | Borrower | Loan Amount |
|---|---|---|---|
| Previous Owner | Miner Raymond E | $18,000 |
Source: Public Records
Tax History
| Year | Tax Paid | Tax Assessment Tax Assessment Total Assessment is a certain percentage of the fair market value that is determined by local assessors to be the total taxable value of land and additions on the property. | Land | Improvement |
|---|---|---|---|---|
| 2025 | $4,929 | $219,800 | $97,800 | $122,000 |
| 2024 | $4,929 | $205,900 | $93,100 | $112,800 |
| 2023 | $3,946 | $179,500 | $84,500 | $95,000 |
| 2022 | $2,265 | $179,500 | $84,500 | $95,000 |
| 2021 | $0 | $178,400 | $83,300 | $95,100 |
| 2020 | $4,604 | $179,900 | $87,200 | $92,700 |
| 2019 | $5,254 | $174,000 | $87,200 | $86,800 |
| 2018 | $0 | $177,600 | $87,200 | $90,400 |
| 2017 | -- | $177,600 | $87,200 | $90,400 |
| 2016 | -- | $177,600 | $87,200 | $90,400 |
| 2015 | -- | $189,700 | $87,200 | $102,500 |
| 2014 | -- | $189,700 | $87,200 | $102,500 |
Source: Public Records
Map
Nearby Homes
Your Personal Tour Guide
Ask me questions while you tour the home.