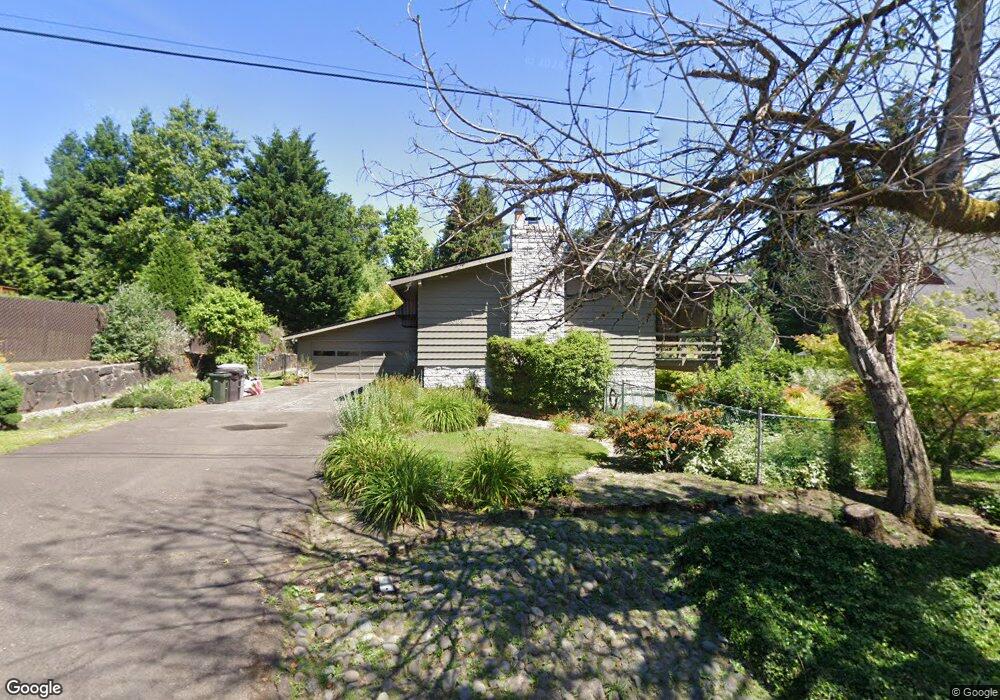
2069 Dillow Dr West Linn, OR 97068
Bolton NeighborhoodEstimated Value: $731,000 - $809,000
4
Beds
3
Baths
2,708
Sq Ft
$283/Sq Ft
Est. Value
About This Home
This home is located at 2069 Dillow Dr, West Linn, OR 97068 and is currently estimated at $766,985, approximately $283 per square foot. 2069 Dillow Dr is a home located in Clackamas County with nearby schools including Cedaroak Park Primary School, West Linn High School, and Clackamas Academy of Industrial Sciences (CAIS).
Ownership History
Date
Name
Owned For
Owner Type
Purchase Details
Closed on
Jun 28, 2000
Sold by
Moss Cynthia A and Runey Jeffrey P
Bought by
Effenberger Susan
Current Estimated Value
Home Financials for this Owner
Home Financials are based on the most recent Mortgage that was taken out on this home.
Original Mortgage
$140,000
Outstanding Balance
$50,211
Interest Rate
8.67%
Estimated Equity
$716,775
Purchase Details
Closed on
Dec 27, 1996
Sold by
Boyle Richard O and Boyle Beverly J
Bought by
Moss Cynthia A and Runey Jefferey P
Home Financials for this Owner
Home Financials are based on the most recent Mortgage that was taken out on this home.
Original Mortgage
$144,000
Interest Rate
8.14%
Purchase Details
Closed on
Nov 4, 1996
Sold by
Boyle Richard O and Boyle Beverly J
Bought by
Runey Jeffrey P and Moss Cynthia A
Home Financials for this Owner
Home Financials are based on the most recent Mortgage that was taken out on this home.
Original Mortgage
$144,000
Interest Rate
8.14%
Create a Home Valuation Report for This Property
The Home Valuation Report is an in-depth analysis detailing your home's value as well as a comparison with similar homes in the area
Home Values in the Area
Average Home Value in this Area
Purchase History
| Date | Buyer | Sale Price | Title Company |
|---|---|---|---|
| Effenberger Susan | $225,000 | Pacific Nw Title | |
| Moss Cynthia A | $50,000 | Ticor Title Insurance | |
| Runey Jeffrey P | $194,000 | Ticor Title Insurance |
Source: Public Records
Mortgage History
| Date | Status | Borrower | Loan Amount |
|---|---|---|---|
| Open | Effenberger Susan | $140,000 | |
| Previous Owner | Runey Jeffrey P | $144,000 |
Source: Public Records
Tax History Compared to Growth
Tax History
| Year | Tax Paid | Tax Assessment Tax Assessment Total Assessment is a certain percentage of the fair market value that is determined by local assessors to be the total taxable value of land and additions on the property. | Land | Improvement |
|---|---|---|---|---|
| 2025 | $6,626 | $343,846 | -- | -- |
| 2024 | $6,378 | $333,832 | -- | -- |
| 2023 | $6,378 | $324,109 | $0 | $0 |
| 2022 | $6,020 | $314,669 | $0 | $0 |
| 2021 | $5,715 | $305,504 | $0 | $0 |
| 2020 | $5,754 | $296,606 | $0 | $0 |
| 2019 | $5,487 | $287,967 | $0 | $0 |
| 2018 | $5,242 | $279,580 | $0 | $0 |
| 2017 | $5,039 | $271,437 | $0 | $0 |
| 2016 | $4,908 | $263,531 | $0 | $0 |
| 2015 | $4,636 | $255,855 | $0 | $0 |
| 2014 | $4,368 | $248,403 | $0 | $0 |
Source: Public Records
Map
Nearby Homes
- 6403 Tompkins Ct
- 6345 Caufield St
- 2488 Tulane St
- 20930 Fawn Ct Unit 26
- 1954 Buck St
- 2700 Underhill Ln Unit 1
- 19697 SE Cottonwood St
- 5128 Firwood Dr
- 5910 W A St
- 5219 Summit St
- 4050 Serango Ct
- 20120 Larkspur Ln Unit 85
- 4622 Mapleton Dr
- 20080 Larkspur Ln Unit 50
- 2583 Pimlico Dr
- 4200 SE Hull Ave
- 20070 Larkspur Ln Unit 61
- 19503 SE Kay St
- 4610 Kenthorpe Way
- 19575 River Rd Unit 53
- 2079 Dillow Dr
- 2057 Dillow Dr
- 2120 Maple Terrace
- 22051 Dillow Dr
- 2130 Maple Terrace
- 2070 Dillow Dr
- 2110 Dillow Dr
- 2050 Dillow Dr
- 2135 Dillow Dr
- 2045 Dillow Dr
- 2080 Maple Terrace
- 2140 Maple Terrace
- 2122 Dillow Dr
- 2040 Maple Terrace
- 2040 Dillow Dr
- 2105 Willamette View Ct
- 2019 Willamette View Ct
- 2020 Maple Terrace
- 2095 Maple Te
- 2095 Maple Terrace