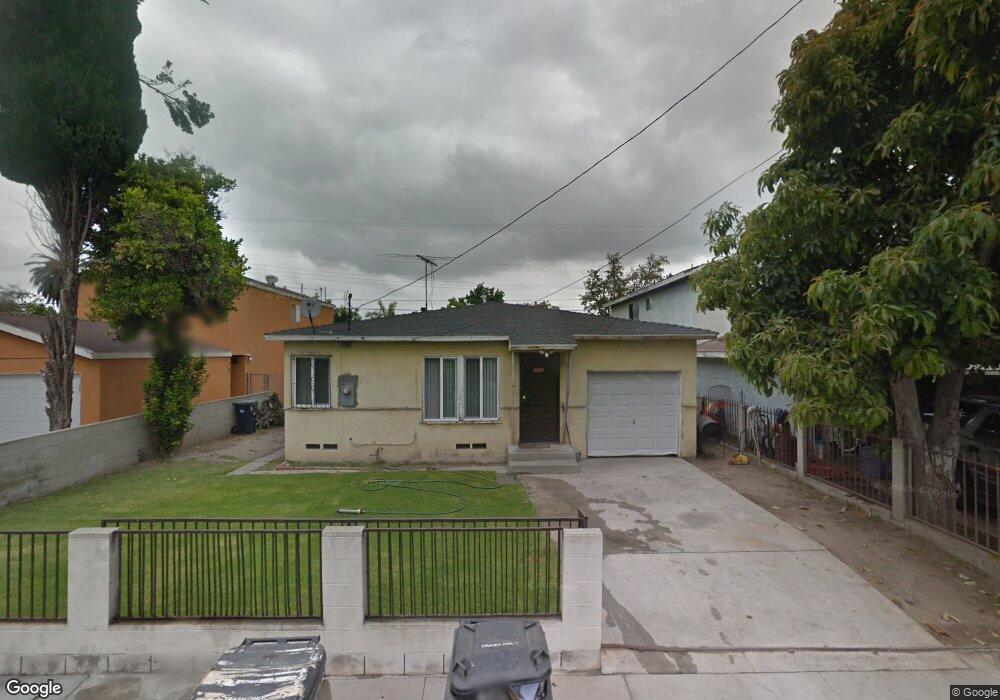
2069 E Oris St Compton, CA 90222
Estimated Value: $493,469 - $531,000
2
Beds
1
Bath
922
Sq Ft
$553/Sq Ft
Est. Value
About This Home
This home is located at 2069 E Oris St, Compton, CA 90222 and is currently estimated at $509,867, approximately $553 per square foot. 2069 E Oris St is a home located in Los Angeles County with nearby schools including Washington Elementary School, Benjamin O. Davis Middle School, and Compton High School.
Ownership History
Date
Name
Owned For
Owner Type
Purchase Details
Closed on
May 15, 2013
Sold by
Hall Jacqueline
Bought by
Hall Jacqueline and Hall Terrence
Current Estimated Value
Purchase Details
Closed on
Jul 25, 2008
Sold by
Blount Jacqueline
Bought by
Blount Jacqueline and Blount Living Trust
Home Financials for this Owner
Home Financials are based on the most recent Mortgage that was taken out on this home.
Original Mortgage
$125,000
Outstanding Balance
$80,171
Interest Rate
6.04%
Mortgage Type
New Conventional
Estimated Equity
$429,696
Purchase Details
Closed on
Jun 5, 2008
Sold by
Blount Jacqueline
Bought by
Blount Jacqueline
Home Financials for this Owner
Home Financials are based on the most recent Mortgage that was taken out on this home.
Original Mortgage
$125,000
Outstanding Balance
$80,171
Interest Rate
6.04%
Mortgage Type
New Conventional
Estimated Equity
$429,696
Purchase Details
Closed on
Aug 27, 1997
Sold by
Logan Karl
Bought by
Logan Jacqueline
Create a Home Valuation Report for This Property
The Home Valuation Report is an in-depth analysis detailing your home's value as well as a comparison with similar homes in the area
Home Values in the Area
Average Home Value in this Area
Purchase History
| Date | Buyer | Sale Price | Title Company |
|---|---|---|---|
| Hall Jacqueline | -- | None Available | |
| Blount Jacqueline | -- | None Available | |
| Blount Jacqueline | -- | Landsafe Title | |
| Logan Jacqueline | -- | -- |
Source: Public Records
Mortgage History
| Date | Status | Borrower | Loan Amount |
|---|---|---|---|
| Open | Blount Jacqueline | $125,000 |
Source: Public Records
Tax History
| Year | Tax Paid | Tax Assessment Tax Assessment Total Assessment is a certain percentage of the fair market value that is determined by local assessors to be the total taxable value of land and additions on the property. | Land | Improvement |
|---|---|---|---|---|
| 2025 | $725 | $28,864 | $10,754 | $18,110 |
| 2024 | $725 | $28,299 | $10,544 | $17,755 |
| 2023 | $720 | $27,745 | $10,338 | $17,407 |
| 2022 | $710 | $27,202 | $10,136 | $17,066 |
| 2021 | $698 | $26,670 | $9,938 | $16,732 |
| 2019 | $688 | $25,882 | $9,645 | $16,237 |
| 2018 | $637 | $25,375 | $9,456 | $15,919 |
| 2016 | $804 | $24,391 | $9,090 | $15,301 |
| 2015 | $598 | $24,026 | $8,954 | $15,072 |
| 2014 | $680 | $23,556 | $8,779 | $14,777 |
Source: Public Records
Map
Nearby Homes
- 2062 E Hatchway St
- 2107 E Stockwell St
- 1608 N Grape Ave
- 701 W 139th St
- 629 W Plum St
- 720 W 137th St
- 521 W Cherry St
- 2223 E Oris St
- 2102 E Lucien St
- 1808 N Grape Ave
- 522 W Cherry St
- 348 W Peach St
- 720 W Cherry St
- 418 W Spruce St
- 363 W Spruce St
- 2310 E Stockwell St
- 2207 N Anzac Ave
- 806 W Spruce St
- 2401 E Hatchway St
- 905 N Hickory Ave
- 2071 E Oris St
- 2063 E Oris St
- 2073 E Oris St
- 2061 E Oris St
- 2075 E Oris St
- 2059 E Oris St
- 2068 E Bliss St
- 2070 E Bliss St
- 2079 E Oris St
- 2057 E Oris St
- 2058 E Bliss St
- 2081 E Oris St
- 2055 E Oris St
- 2076 E Bliss St
- 2066 E Oris St
- 2062 E Oris St
- 2070 E Oris St
- 2054 E Bliss St
- 2060 E Oris St
- 2083 E Oris St
Your Personal Tour Guide
Ask me questions while you tour the home.