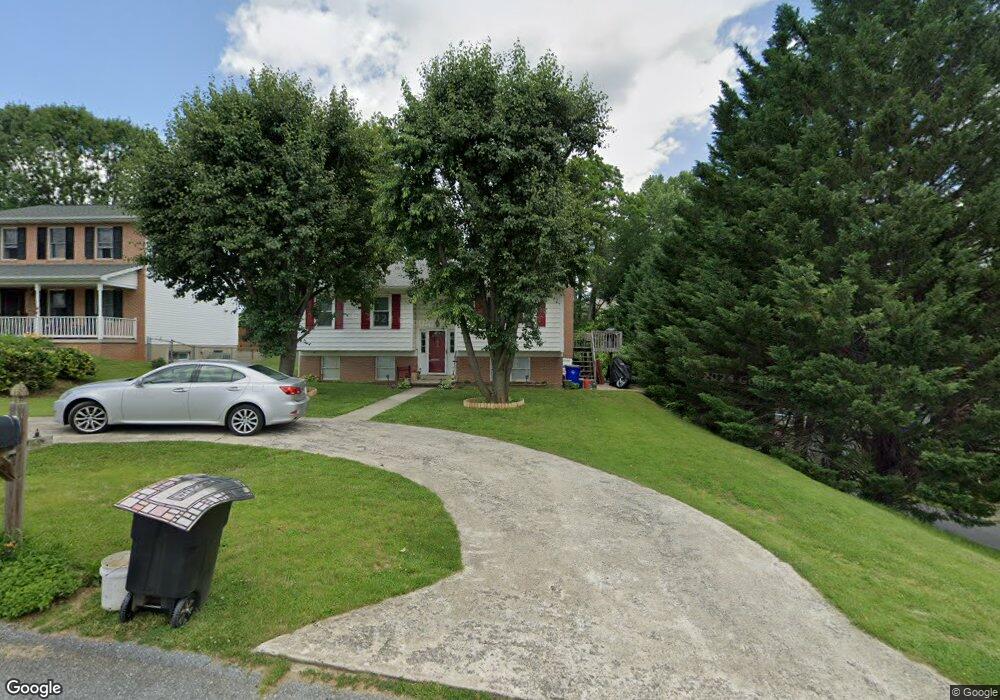
207 E G St Brunswick, MD 21716
Estimated Value: $254,000 - $372,000
3
Beds
2
Baths
1,472
Sq Ft
$220/Sq Ft
Est. Value
About This Home
This home is located at 207 E G St, Brunswick, MD 21716 and is currently estimated at $323,716, approximately $219 per square foot. 207 E G St is a home located in Frederick County with nearby schools including Brunswick Elementary School, Brunswick Middle School, and Brunswick High School.
Ownership History
Date
Name
Owned For
Owner Type
Purchase Details
Closed on
Dec 21, 2010
Sold by
Federal National Mortgage Association
Bought by
Campbell Chelaya
Current Estimated Value
Home Financials for this Owner
Home Financials are based on the most recent Mortgage that was taken out on this home.
Original Mortgage
$170,775
Outstanding Balance
$113,686
Interest Rate
4.37%
Mortgage Type
New Conventional
Estimated Equity
$210,030
Purchase Details
Closed on
Jun 16, 2010
Sold by
Lewis Linda
Bought by
Federal National Mortgage Association
Purchase Details
Closed on
Mar 13, 2003
Sold by
Lewis Rose C
Bought by
Lewis Linda
Create a Home Valuation Report for This Property
The Home Valuation Report is an in-depth analysis detailing your home's value as well as a comparison with similar homes in the area
Home Values in the Area
Average Home Value in this Area
Purchase History
| Date | Buyer | Sale Price | Title Company |
|---|---|---|---|
| Campbell Chelaya | $165,000 | -- | |
| Federal National Mortgage Association | $201,000 | -- | |
| Lewis Linda | -- | -- |
Source: Public Records
Mortgage History
| Date | Status | Borrower | Loan Amount |
|---|---|---|---|
| Open | Campbell Chelaya | $170,775 |
Source: Public Records
Tax History
| Year | Tax Paid | Tax Assessment Tax Assessment Total Assessment is a certain percentage of the fair market value that is determined by local assessors to be the total taxable value of land and additions on the property. | Land | Improvement |
|---|---|---|---|---|
| 2025 | $3,160 | $237,400 | -- | -- |
| 2024 | $3,160 | $218,100 | $89,800 | $128,300 |
| 2023 | $2,917 | $200,600 | $0 | $0 |
| 2022 | $2,772 | $183,100 | $0 | $0 |
| 2021 | $2,514 | $165,600 | $63,300 | $102,300 |
| 2020 | $2,514 | $157,267 | $0 | $0 |
| 2019 | $2,397 | $148,933 | $0 | $0 |
| 2018 | $2,326 | $140,600 | $45,500 | $95,100 |
| 2017 | $2,294 | $140,600 | $0 | $0 |
| 2016 | $2,463 | $138,200 | $0 | $0 |
| 2015 | $2,463 | $137,000 | $0 | $0 |
| 2014 | $2,463 | $137,000 | $0 | $0 |
Source: Public Records
Map
Nearby Homes
- 23 E F St
- 37 E C St
- 519 N Maple Ave
- 13 E C St
- 11 W I St
- 0 E D St Unit MDFR2057714
- 7 W B St
- 21 W Orndorff Dr
- 805 E B St
- 8 S Maple Ave
- 709 E Potomac St
- 15 N Maryland Ave
- 9 9th Ave
- TBB Shenandoah View Pkwy Unit ORCHID
- TBB Shenandoah View Pkwy Unit DAHLIA
- 8 N Virginia Ave
- Homesite 232 Potomac View Pkwy
- 926 E A St
- 213 Wintergreen Ln
- 603 Martins Creek Dr
Your Personal Tour Guide
Ask me questions while you tour the home.