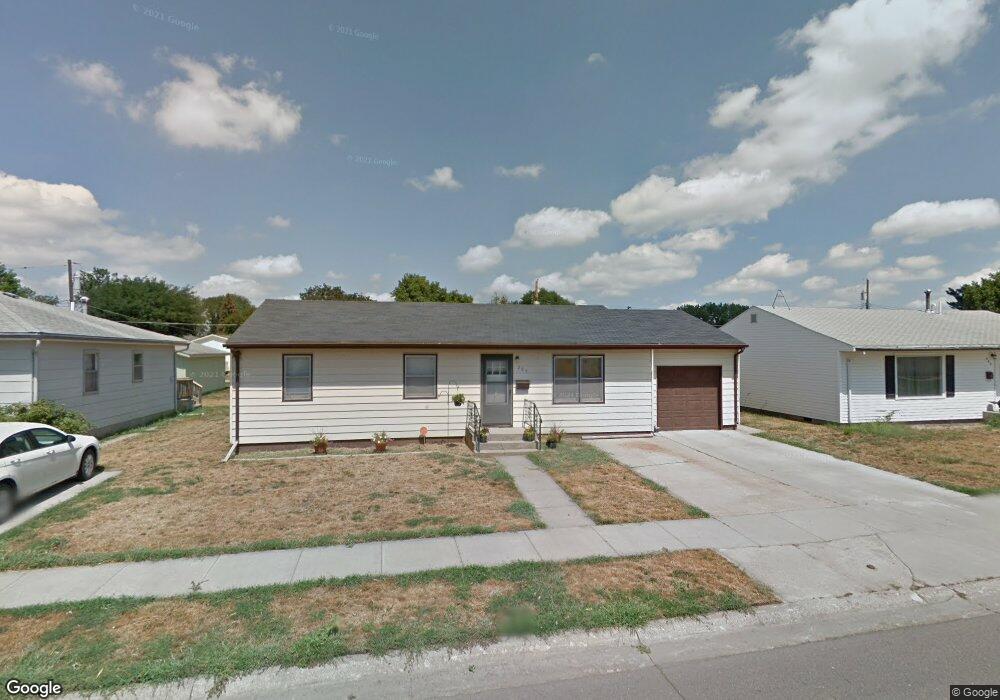
207 E Walnut Ave Norfolk, NE 68701
Estimated Value: $175,000 - $195,691
3
Beds
2
Baths
1,092
Sq Ft
$169/Sq Ft
Est. Value
About This Home
This home is located at 207 E Walnut Ave, Norfolk, NE 68701 and is currently estimated at $184,173, approximately $168 per square foot. 207 E Walnut Ave is a home located in Madison County with nearby schools including Norfolk Senior High School, Keystone Christian Academy, and Park Avenue Christian School.
Ownership History
Date
Name
Owned For
Owner Type
Purchase Details
Closed on
Jan 17, 2014
Sold by
Wc Properties Llc
Bought by
Geihsler Rodney E
Current Estimated Value
Home Financials for this Owner
Home Financials are based on the most recent Mortgage that was taken out on this home.
Original Mortgage
$58,150
Outstanding Balance
$43,644
Interest Rate
4.47%
Mortgage Type
New Conventional
Estimated Equity
$140,529
Purchase Details
Closed on
Apr 22, 2011
Sold by
Hansen Kimbelry M
Bought by
Wc Properties Llc
Purchase Details
Closed on
Jan 20, 2009
Sold by
Forsell Lloyd
Bought by
Forsell Tr Lloyd
Purchase Details
Closed on
Jun 16, 2005
Sold by
Thelen Daniel P and Thelen Sharolyn M
Bought by
Forsell Lloyd
Purchase Details
Closed on
Jun 13, 2005
Sold by
Thelen Daniel P and Thelen Sharolyn M
Bought by
Forsell Lloyd
Create a Home Valuation Report for This Property
The Home Valuation Report is an in-depth analysis detailing your home's value as well as a comparison with similar homes in the area
Home Values in the Area
Average Home Value in this Area
Purchase History
| Date | Buyer | Sale Price | Title Company |
|---|---|---|---|
| Geihsler Rodney E | $66,000 | American Title & Escrow Co | |
| Wc Properties Llc | $55,000 | None Available | |
| Forsell Tr Lloyd | -- | -- | |
| Forsell Lloyd | -- | None Available | |
| Forsell Lloyd | $56,000 | Northeast Nebr Title | |
| Forsell Lloyd | $71,250 | -- |
Source: Public Records
Mortgage History
| Date | Status | Borrower | Loan Amount |
|---|---|---|---|
| Open | Geihsler Rodney E | $58,150 |
Source: Public Records
Tax History
| Year | Tax Paid | Tax Assessment Tax Assessment Total Assessment is a certain percentage of the fair market value that is determined by local assessors to be the total taxable value of land and additions on the property. | Land | Improvement |
|---|---|---|---|---|
| 2025 | $1,584 | $136,438 | $7,872 | $128,566 |
| 2024 | $1,584 | $126,915 | $7,872 | $119,043 |
| 2023 | $2,111 | $114,160 | $7,872 | $106,288 |
| 2022 | $1,905 | $102,772 | $7,872 | $94,900 |
| 2021 | $1,713 | $92,604 | $7,872 | $84,732 |
| 2020 | $1,541 | $83,526 | $7,872 | $75,654 |
| 2019 | $1,441 | $75,420 | $7,872 | $67,548 |
| 2018 | $1,355 | $72,140 | $7,872 | $64,268 |
| 2017 | $1,258 | $66,895 | $7,872 | $59,023 |
| 2016 | $1,211 | $64,270 | $7,872 | $56,398 |
| 2015 | $1,211 | $64,270 | $7,872 | $56,398 |
| 2014 | $1,248 | $64,270 | $7,872 | $56,398 |
| 2013 | $1,476 | $73,649 | $7,465 | $66,184 |
Source: Public Records
Map
Nearby Homes
- 205 E Walnut Ave
- 209 E Walnut Ave
- 203 E Walnut Ave
- 211 E Walnut Ave
- 206 E Maple Ave
- 204 E Maple Ave
- 206 E Walnut Ave
- 204 E Walnut Ave
- 208 E Walnut Ave
- 201 E Walnut Ave
- 202 E Maple Ave
- 301 E Walnut Ave
- 300 E Maple Ave
- 202 E Walnut Ave
- 210 E Walnut Ave
- 200 E Maple Ave
- 304 E Maple Ave
- 300 E Walnut Ave
- 302 E Walnut Ave
- 302 E Walnut Ave
Your Personal Tour Guide
Ask me questions while you tour the home.