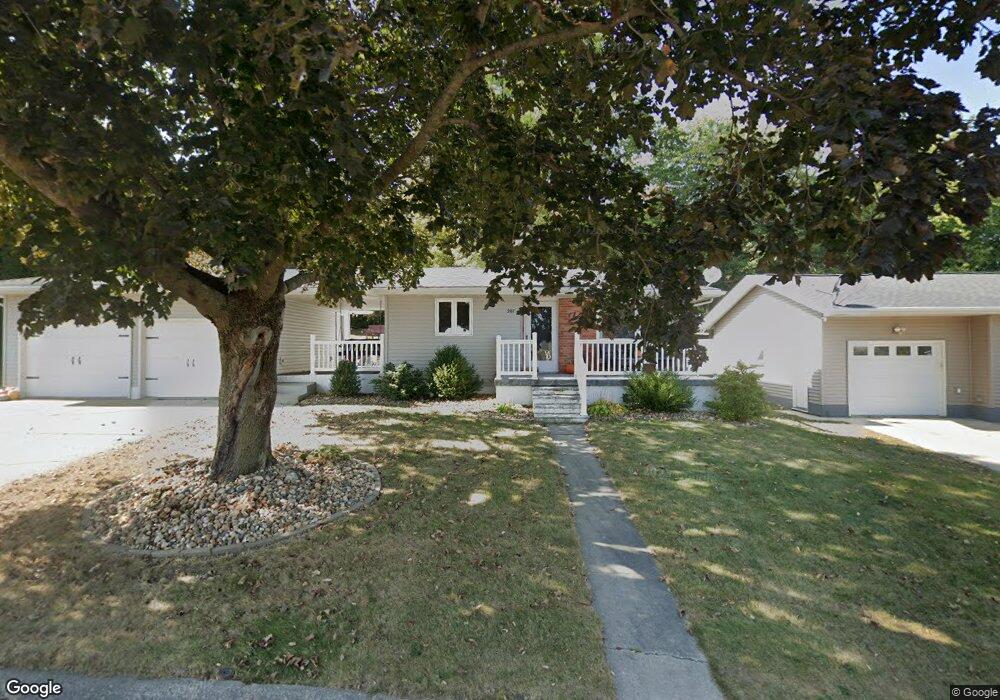
207 Harrison St NW Cascade, IA 52033
Estimated Value: $209,000 - $242,000
3
Beds
2
Baths
1,256
Sq Ft
$180/Sq Ft
Est. Value
About This Home
This home is located at 207 Harrison St NW, Cascade, IA 52033 and is currently estimated at $225,810, approximately $179 per square foot. 207 Harrison St NW is a home located in Dubuque County with nearby schools including Cascade Elementary School, Cascade Junior/Senior High School, and Aquin Catholic Elementary School.
Ownership History
Date
Name
Owned For
Owner Type
Purchase Details
Closed on
Apr 4, 2024
Sold by
Harmeyer Emma L and Pitz Logan W
Bought by
Kluesner Justin M and Kluesner Tayler R
Current Estimated Value
Home Financials for this Owner
Home Financials are based on the most recent Mortgage that was taken out on this home.
Original Mortgage
$220,000
Outstanding Balance
$216,523
Interest Rate
6.9%
Mortgage Type
New Conventional
Estimated Equity
$9,287
Purchase Details
Closed on
Dec 31, 2018
Sold by
Mcquillen Tyler H and Mcquillen Toni
Bought by
Pitz Logan W and Harmeyer Emma L
Home Financials for this Owner
Home Financials are based on the most recent Mortgage that was taken out on this home.
Original Mortgage
$157,102
Interest Rate
4.8%
Mortgage Type
FHA
Purchase Details
Closed on
Sep 22, 2011
Sold by
Cigrand Margaret L
Bought by
Mcquillen Tyler H and Finn Toi
Create a Home Valuation Report for This Property
The Home Valuation Report is an in-depth analysis detailing your home's value as well as a comparison with similar homes in the area
Home Values in the Area
Average Home Value in this Area
Purchase History
| Date | Buyer | Sale Price | Title Company |
|---|---|---|---|
| Kluesner Justin M | $235,000 | None Listed On Document | |
| Pitz Logan W | $160,000 | None Available | |
| Mcquillen Tyler H | $130,000 | None Available |
Source: Public Records
Mortgage History
| Date | Status | Borrower | Loan Amount |
|---|---|---|---|
| Open | Kluesner Justin M | $220,000 | |
| Previous Owner | Pitz Logan W | $157,102 |
Source: Public Records
Tax History Compared to Growth
Tax History
| Year | Tax Paid | Tax Assessment Tax Assessment Total Assessment is a certain percentage of the fair market value that is determined by local assessors to be the total taxable value of land and additions on the property. | Land | Improvement |
|---|---|---|---|---|
| 2025 | $2,824 | $216,100 | $35,900 | $180,200 |
| 2024 | $2,824 | $199,200 | $35,900 | $163,300 |
| 2023 | $2,662 | $199,200 | $35,900 | $163,300 |
| 2022 | $2,088 | $151,520 | $35,860 | $115,660 |
| 2021 | $2,088 | $151,520 | $35,860 | $115,660 |
| 2020 | $1,900 | $133,200 | $33,300 | $99,900 |
| 2019 | $2,100 | $133,200 | $33,300 | $99,900 |
| 2018 | $2,016 | $130,980 | $26,070 | $104,910 |
| 2017 | $2,030 | $128,960 | $26,070 | $102,890 |
| 2016 | $2,030 | $124,980 | $24,590 | $100,390 |
| 2015 | $1,986 | $124,980 | $24,590 | $100,390 |
| 2014 | $1,976 | $120,770 | $24,590 | $96,180 |
Source: Public Records
Map
Nearby Homes
- 815 4th Ave SW
- 820 5th Ave SW
- 1013 Clare Ct NW Unit Northwest
- 1115 NW Clare Ct
- 816 6th Ave NW
- 601 7th Ave SW
- 319 2nd Ave SW
- 313 1st Ave E
- 105 Harrison St SE
- 616 4th Ave SE
- 1113 2nd Ave SE
- 136 Jack Oak Dr
- 8282 County Road E17
- 3108 324th St
- 204 1st Ave W
- Lot 7 4th St SW
- Lot 2 NW 4th Ave
- Lot 3 NW 4th Ave
- Lot 17 NW 4th Ave
- Lot 18 NW 4th Ave
- 808 2nd Ave NW
- 215 Harrison St NW
- 206 Harrison St NW
- 210 Harrison St NW
- 804 2nd Ave NW
- 214 Harrison St NW
- 219 Harrison St NW
- 817 2nd Ave NW
- 821 2nd Ave NW
- 813 2nd Ave NW
- 218 Harrison St NW
- 809 2nd Ave NW
- 223 Harrison St NW
- 805 2nd Ave NW
- 224 Harrison St NW
- 209 Cleveland Ct NW
- 722 2nd Ave NW
- 803 2nd Ave NW
- 213 Cleveland Ct NW
- 231 Harrison St NW