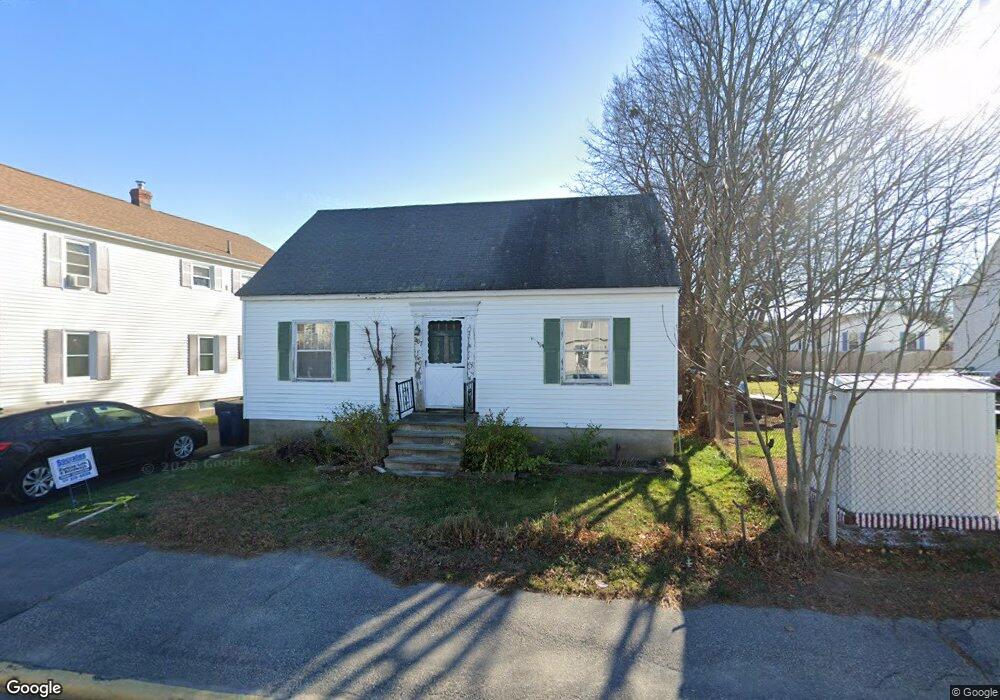
207 Hill St Biddeford, ME 04005
Estimated Value: $381,768 - $410,000
3
Beds
1
Bath
1,142
Sq Ft
$342/Sq Ft
Est. Value
About This Home
This home is located at 207 Hill St, Biddeford, ME 04005 and is currently estimated at $390,692, approximately $342 per square foot. 207 Hill St is a home located in York County with nearby schools including John F Kennedy Memorial School, Biddeford Primary School, and Biddeford Intermediate School.
Ownership History
Date
Name
Owned For
Owner Type
Purchase Details
Closed on
Oct 28, 2011
Sold by
Mouzas Peter J
Bought by
Ocwen Loan Servicing Llc
Current Estimated Value
Purchase Details
Closed on
Jan 19, 2007
Sold by
Zimniski Mary
Bought by
Mouzas Peter J
Home Financials for this Owner
Home Financials are based on the most recent Mortgage that was taken out on this home.
Original Mortgage
$175,000
Interest Rate
6.14%
Mortgage Type
Unknown
Create a Home Valuation Report for This Property
The Home Valuation Report is an in-depth analysis detailing your home's value as well as a comparison with similar homes in the area
Home Values in the Area
Average Home Value in this Area
Purchase History
| Date | Buyer | Sale Price | Title Company |
|---|---|---|---|
| Ocwen Loan Servicing Llc | $170,376 | -- | |
| Mouzas Peter J | -- | -- |
Source: Public Records
Mortgage History
| Date | Status | Borrower | Loan Amount |
|---|---|---|---|
| Previous Owner | Mouzas Peter J | $175,000 |
Source: Public Records
Tax History Compared to Growth
Tax History
| Year | Tax Paid | Tax Assessment Tax Assessment Total Assessment is a certain percentage of the fair market value that is determined by local assessors to be the total taxable value of land and additions on the property. | Land | Improvement |
|---|---|---|---|---|
| 2024 | $3,497 | $245,900 | $137,500 | $108,400 |
| 2023 | $3,193 | $243,400 | $135,000 | $108,400 |
| 2022 | $3,092 | $188,400 | $70,200 | $118,200 |
| 2021 | $2,875 | $157,700 | $59,400 | $98,300 |
| 2020 | $2,877 | $143,500 | $54,000 | $89,500 |
| 2019 | $2,867 | $143,500 | $54,000 | $89,500 |
| 2018 | $2,827 | $143,500 | $54,000 | $89,500 |
| 2017 | $2,814 | $140,200 | $54,000 | $86,200 |
| 2016 | $2,784 | $140,200 | $54,000 | $86,200 |
| 2015 | $2,535 | $140,200 | $54,000 | $86,200 |
| 2014 | $2,473 | $140,200 | $54,000 | $86,200 |
| 2013 | -- | $147,700 | $54,700 | $93,000 |
Source: Public Records
Map
Nearby Homes