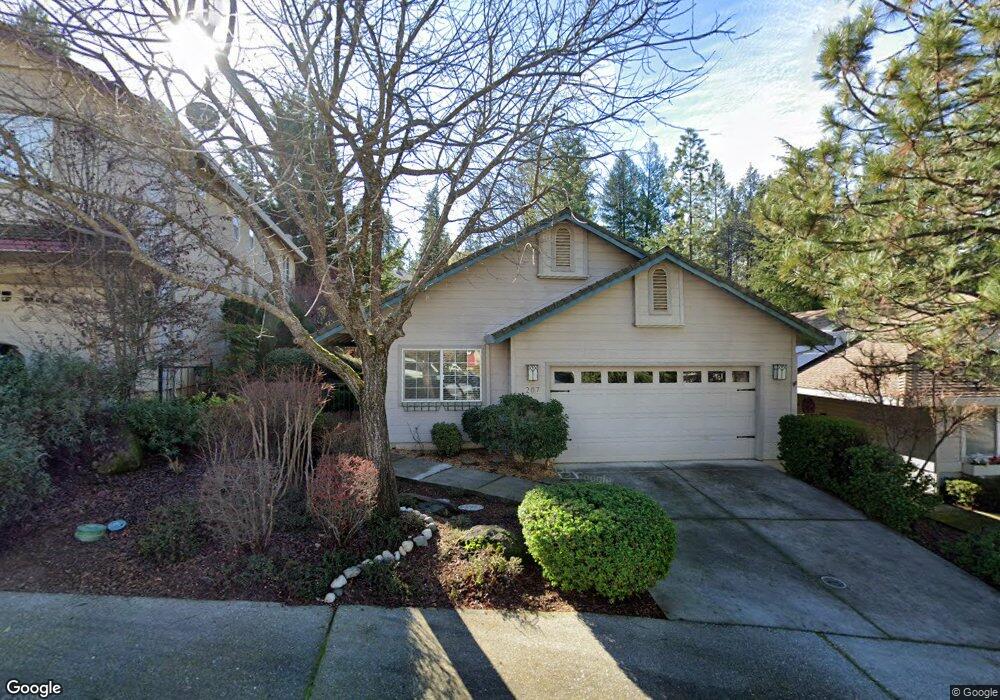
207 Incline Dr Colfax, CA 95713
Estimated Value: $350,990 - $440,000
3
Beds
2
Baths
1,281
Sq Ft
$307/Sq Ft
Est. Value
About This Home
This home is located at 207 Incline Dr, Colfax, CA 95713 and is currently estimated at $392,748, approximately $306 per square foot. 207 Incline Dr is a home located in Placer County with nearby schools including Colfax Elementary School, Colfax High School, and Weimar Academy.
Ownership History
Date
Name
Owned For
Owner Type
Purchase Details
Closed on
Mar 19, 2010
Sold by
Demorest John W and Deaton Elizabeth A
Bought by
Mintline William J and Mintline Mary Kaye
Current Estimated Value
Home Financials for this Owner
Home Financials are based on the most recent Mortgage that was taken out on this home.
Original Mortgage
$100,000
Outstanding Balance
$66,145
Interest Rate
4.94%
Mortgage Type
Seller Take Back
Estimated Equity
$326,603
Purchase Details
Closed on
May 17, 2001
Sold by
Sanchez Lisa and Sanchez Christopher
Bought by
Demorest John W and Deaton Elizabeth A
Purchase Details
Closed on
Aug 12, 1999
Sold by
Pacific Research & Development Inc
Bought by
Sanchez Christopher and Sanchez Lisa
Home Financials for this Owner
Home Financials are based on the most recent Mortgage that was taken out on this home.
Original Mortgage
$107,185
Interest Rate
10.99%
Mortgage Type
Purchase Money Mortgage
Create a Home Valuation Report for This Property
The Home Valuation Report is an in-depth analysis detailing your home's value as well as a comparison with similar homes in the area
Home Values in the Area
Average Home Value in this Area
Purchase History
| Date | Buyer | Sale Price | Title Company |
|---|---|---|---|
| Mintline William J | $205,000 | Placer Title Company | |
| Demorest John W | $182,500 | Placer Title Company | |
| Sanchez Christopher | $165,000 | Old Republic Title Company | |
| Pacific Research & Development Inc | $45,000 | Old Republic Title Company | |
| Dwelle David W | -- | Old Republic Title Company |
Source: Public Records
Mortgage History
| Date | Status | Borrower | Loan Amount |
|---|---|---|---|
| Open | Mintline William J | $100,000 | |
| Previous Owner | Sanchez Christopher | $107,185 | |
| Closed | Sanchez Christopher | $41,225 |
Source: Public Records
Tax History
| Year | Tax Paid | Tax Assessment Tax Assessment Total Assessment is a certain percentage of the fair market value that is determined by local assessors to be the total taxable value of land and additions on the property. | Land | Improvement |
|---|---|---|---|---|
| 2025 | $2,648 | $264,603 | $83,895 | $180,708 |
| 2023 | $2,648 | $254,330 | $80,638 | $173,692 |
| 2022 | $2,560 | $249,344 | $79,057 | $170,287 |
| 2021 | $2,504 | $244,456 | $77,507 | $166,949 |
| 2020 | $2,474 | $241,951 | $76,713 | $165,238 |
| 2019 | $2,424 | $237,208 | $75,209 | $161,999 |
| 2018 | $2,338 | $232,558 | $73,735 | $158,823 |
| 2017 | $2,226 | $214,000 | $67,900 | $146,100 |
| 2016 | $1,997 | $192,000 | $60,900 | $131,100 |
| 2015 | $1,888 | $183,000 | $58,000 | $125,000 |
| 2014 | $1,787 | $172,000 | $54,500 | $117,500 |
Source: Public Records
Map
Nearby Homes
- 308 Canyon Creek Dr
- 250 Canyon Creek Cir
- 23325 Tree Farm Rd
- 1836 Canyon Way
- 7-Acres Canyon Way
- 23025 Placer Hills Rd
- 1384 Oak Ridge Dr
- 1045 Sierra Dawn Ln
- 508 Chase Ct
- 155 Whitcomb Ave
- 24005 Fowler Ave
- 22500 Canyon Way
- 34 Washington
- 24275 Grand View Ave
- 30 Lincoln St
- 333 Pine St
- Milk Ranch Rd
- 15 Sunset Ave
- 0 Kneeland St Unit 225109849
- 102 Shadow Wood Place
- 201 Incline Dr
- 0 Canyon Creek Dr
- 217 Incline Dr
- 219 Incline Dr
- 204 Incline Dr
- 210 Incline Dr
- 200 Incline Dr
- 218 Incline Dr
- 225 Incline Dr
- 224 Incline Dr
- 233 Incline Dr
- 205 Canyon Creek Cir
- 230 Incline Dr
- 215 Canyon Creek Cir
- 239 Incline Dr
- 223 Canyon Creek Cir
- 231 Canyon Creek Cir
- 236 Incline Dr
- 245 Incline Dr
- 235 Canyon Creek Cir
Your Personal Tour Guide
Ask me questions while you tour the home.