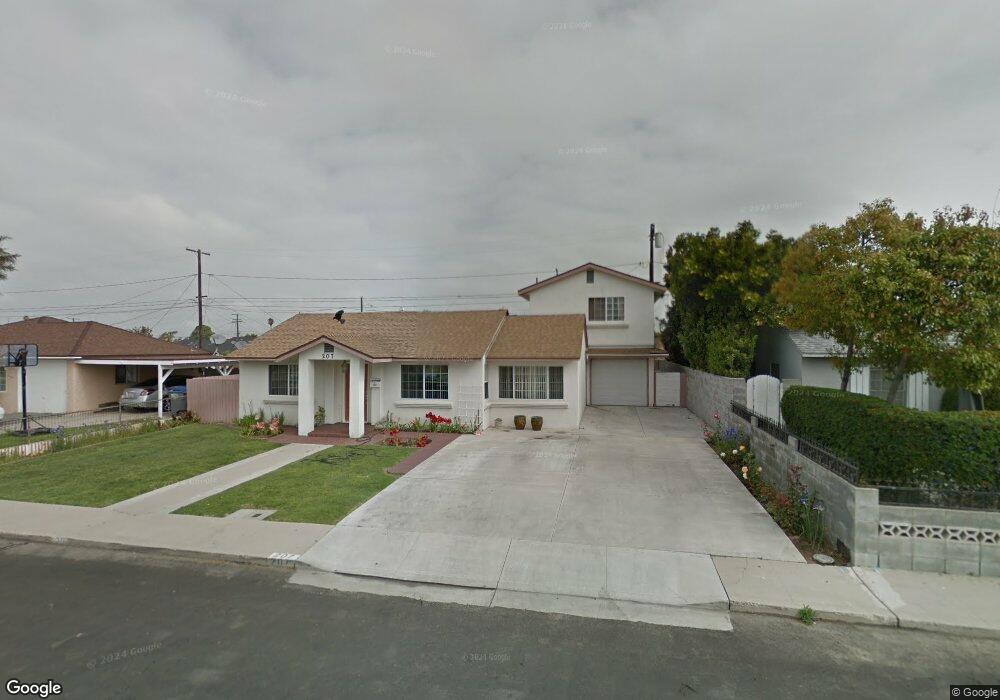
207 James Ave Oxnard, CA 93033
Blackstock North NeighborhoodEstimated Value: $668,000 - $803,000
3
Beds
1
Bath
800
Sq Ft
$913/Sq Ft
Est. Value
About This Home
This home is located at 207 James Ave, Oxnard, CA 93033 and is currently estimated at $730,738, approximately $913 per square foot. 207 James Ave is a home located in Ventura County with nearby schools including Ansgar Larsen Elementary School, Channel Islands High School, and Santa Clara High School.
Ownership History
Date
Name
Owned For
Owner Type
Purchase Details
Closed on
Jun 4, 2018
Sold by
Murillo Antonio Rodriguez and Rodriguez Maria Belia
Bought by
Rodriguez Maria Belia and Maria Belia Rodriguez 2018
Current Estimated Value
Purchase Details
Closed on
Feb 25, 1994
Sold by
Evans Judy Carolyn
Bought by
Rodriguez Antonio and Rodriguez Maria Belia
Home Financials for this Owner
Home Financials are based on the most recent Mortgage that was taken out on this home.
Original Mortgage
$89,000
Interest Rate
7.38%
Create a Home Valuation Report for This Property
The Home Valuation Report is an in-depth analysis detailing your home's value as well as a comparison with similar homes in the area
Home Values in the Area
Average Home Value in this Area
Purchase History
| Date | Buyer | Sale Price | Title Company |
|---|---|---|---|
| Rodriguez Maria Belia | -- | None Available | |
| Rodriguez Antonio Murillo | -- | None Available | |
| Rodriguez Antonio | $114,000 | Chicago Title Co | |
| Rodriguez Antonio | -- | Chicago Title Co |
Source: Public Records
Mortgage History
| Date | Status | Borrower | Loan Amount |
|---|---|---|---|
| Closed | Rodriguez Antonio | $89,000 |
Source: Public Records
Tax History
| Year | Tax Paid | Tax Assessment Tax Assessment Total Assessment is a certain percentage of the fair market value that is determined by local assessors to be the total taxable value of land and additions on the property. | Land | Improvement |
|---|---|---|---|---|
| 2025 | $2,742 | $236,972 | $78,401 | $158,571 |
| 2024 | $2,742 | $232,326 | $76,864 | $155,462 |
| 2023 | $2,587 | $227,771 | $75,357 | $152,414 |
| 2022 | $2,532 | $223,305 | $73,879 | $149,426 |
| 2021 | $2,562 | $218,927 | $72,430 | $146,497 |
| 2020 | $2,608 | $216,685 | $71,689 | $144,996 |
| 2019 | $2,529 | $212,437 | $70,284 | $142,153 |
| 2018 | $2,434 | $208,272 | $68,906 | $139,366 |
| 2017 | $2,354 | $204,189 | $67,555 | $136,634 |
| 2016 | $2,240 | $200,186 | $66,231 | $133,955 |
| 2015 | $2,273 | $197,181 | $65,237 | $131,944 |
| 2014 | $2,231 | $193,320 | $63,960 | $129,360 |
Source: Public Records
Map
Nearby Homes
- 167 Hughes Dr
- 3631 La Costa Place
- 168 Lark St
- 360 Ibsen Place Unit 129
- 300 Ibsen Place Unit 132
- 4160 Petit Dr Unit 39
- 320 Columbia Place Unit 46
- 1036 Cheyenne Way
- 430-440 W Linden Dr
- 3630 Dallas Dr
- 775 Thayer Ln
- 4105 S J St
- 4340 Highland Ave
- 225 W Iris St
- 901 W Olive St
- 1630 Nelson Place
- 4910 Justin Way
- 4731 Hamilton Ave
- 4614 Concord Way
- 5117 Jefferson Square
Your Personal Tour Guide
Ask me questions while you tour the home.