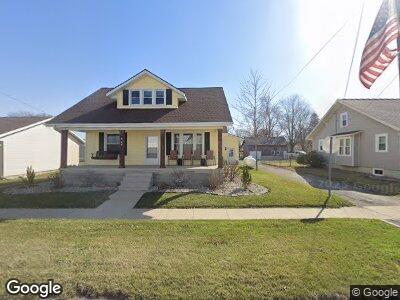
207 N Main St Rawson, OH 45881
Estimated Value: $155,000 - $174,217
4
Beds
3
Baths
1,511
Sq Ft
$107/Sq Ft
Est. Value
About This Home
This home is located at 207 N Main St, Rawson, OH 45881 and is currently estimated at $161,554, approximately $106 per square foot. 207 N Main St is a home with nearby schools including Cory-Rawson Elementary School and Cory-Rawson High School.
Ownership History
Date
Name
Owned For
Owner Type
Purchase Details
Closed on
Oct 18, 2007
Sold by
Wenner Jack and Wenner Shirley
Bought by
Wenner Steven L
Current Estimated Value
Purchase Details
Closed on
Sep 15, 2006
Sold by
Ervin Florence Lee Stanbery
Bought by
Dietsch Carl T and Dietsch Jessica M
Home Financials for this Owner
Home Financials are based on the most recent Mortgage that was taken out on this home.
Original Mortgage
$66,900
Interest Rate
6.59%
Mortgage Type
Purchase Money Mortgage
Purchase Details
Closed on
Jun 28, 2004
Sold by
Brown Jeffrey A and Brown Marjorie A
Bought by
Houck Kenneth W and Houck Wendy R
Home Financials for this Owner
Home Financials are based on the most recent Mortgage that was taken out on this home.
Original Mortgage
$118,750
Interest Rate
6.46%
Mortgage Type
Purchase Money Mortgage
Purchase Details
Closed on
Jun 14, 1988
Bought by
Peterman Kenneth A
Purchase Details
Closed on
Feb 23, 1984
Bought by
Peterman Kenneth A
Create a Home Valuation Report for This Property
The Home Valuation Report is an in-depth analysis detailing your home's value as well as a comparison with similar homes in the area
Home Values in the Area
Average Home Value in this Area
Purchase History
| Date | Buyer | Sale Price | Title Company |
|---|---|---|---|
| Wenner Steven L | -- | Assured Title Agency | |
| Dietsch Carl T | $67,000 | Mid Am Title | |
| Houck Kenneth W | $125,000 | Assured Title | |
| Peterman Kenneth A | -- | -- | |
| Peterman Kenneth A | -- | -- |
Source: Public Records
Mortgage History
| Date | Status | Borrower | Loan Amount |
|---|---|---|---|
| Open | Houck Kenneth W | $139,200 | |
| Previous Owner | Dietsch Carl T | $66,900 | |
| Previous Owner | Houck Kenneth W | $35,000 | |
| Previous Owner | Houck Kenneth W | $118,750 |
Source: Public Records
Tax History Compared to Growth
Tax History
| Year | Tax Paid | Tax Assessment Tax Assessment Total Assessment is a certain percentage of the fair market value that is determined by local assessors to be the total taxable value of land and additions on the property. | Land | Improvement |
|---|---|---|---|---|
| 2024 | $1,598 | $50,400 | $4,200 | $46,200 |
| 2023 | $1,592 | $50,400 | $4,200 | $46,200 |
| 2022 | $2,044 | $50,400 | $4,200 | $46,200 |
| 2021 | $1,856 | $40,820 | $4,420 | $36,400 |
| 2020 | $1,433 | $40,820 | $4,420 | $36,400 |
| 2019 | $1,808 | $40,820 | $4,420 | $36,400 |
| 2018 | $1,451 | $32,860 | $3,400 | $29,460 |
| 2017 | $1,478 | $32,860 | $3,400 | $29,460 |
| 2016 | $1,489 | $32,860 | $3,400 | $29,460 |
| 2015 | $1,467 | $33,980 | $3,400 | $30,580 |
| 2014 | $1,485 | $33,980 | $3,400 | $30,580 |
| 2012 | $1,550 | $33,980 | $3,400 | $30,580 |
Source: Public Records
Map
Nearby Homes
- 0 County Road 12
- 0 Hidden Trails Dr Unit 6127301
- 16392 County Road 12
- 202 S Main St
- 309 Lincoln St
- 0 State Route 12
- 9004 County Road 26
- 9500 County Road 37
- 18875 County Road 12
- 17297 Township Road 51
- 302 E Sandusky St
- 0 Hancock St
- 7016 County Road 86
- 11070 Township Road 67
- 9152 W State Route 12
- 9307 W State Route 12
- 9641 Early Dr
- 9222 Hiegel Dr
- 9277 Colonel Dr
- 9293 Hiegel Dr