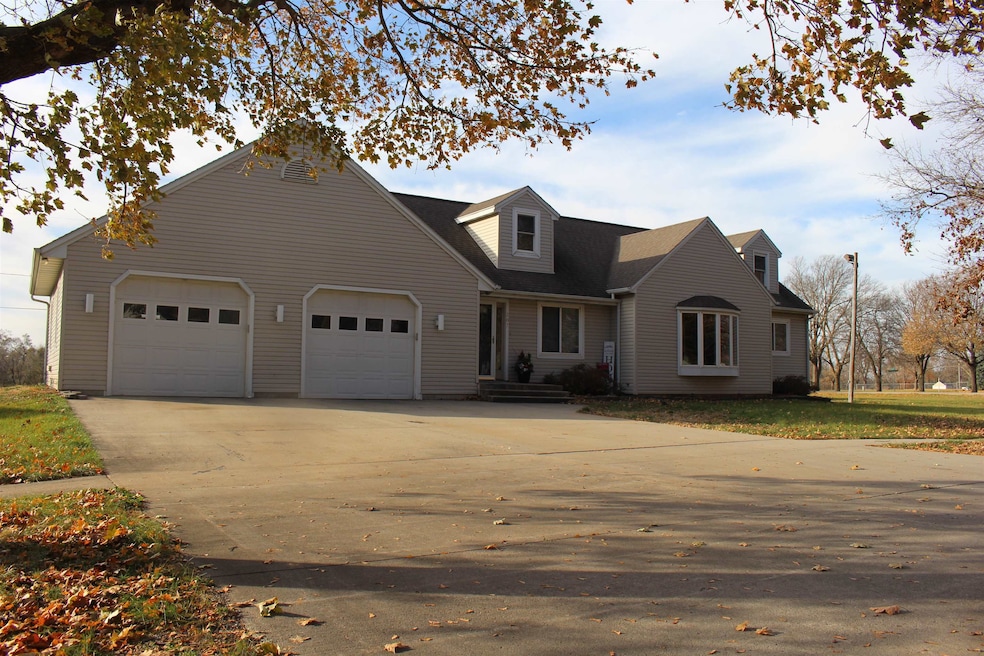
207 Walnut St Auburn, IA 51433
Estimated payment $1,772/month
Highlights
- Open-Concept Dining Room
- Main Floor Bedroom
- 2 Car Attached Garage
- Wood Flooring
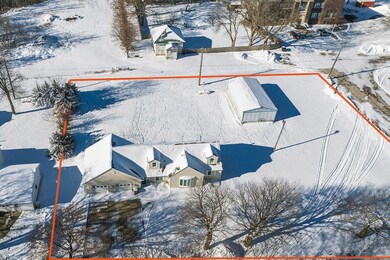
- Corner Lot
- Walk-In Closet
About This Home
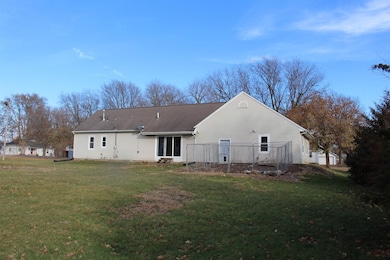
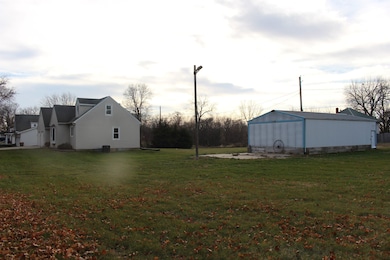
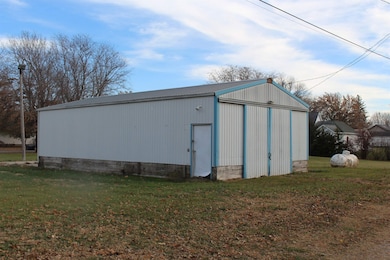
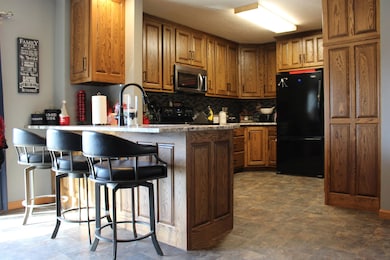
Surrender to Comfort - Tucked into the heart of Auburn, this home invites you in with a sense of ease that only comes from a thoughtful updated design and small-town living. The moment you open the door, sunlight pours through the bay window, casting a warm glow across the hardwood floors and open layout. The living, dining, and kitchen spaces flow together effortlessly. At the center of it all, the kitchen feels like home itself. Granite countertops, a large island, and custom-built cabinetry with pullouts and soft-close features bring both beauty and function to the space. It’s a room made for sharing stories, finishing homework, or catching up over coffee. The main floor primary bedroom offers calm and convenience, paired with generous walk-in closet space. Upstairs, two additional bedrooms provide cozy retreats for family or guests. The main bathroom features a ceramic tile walk-in shower, while the main-floor laundry area adds everyday practicality—with room to finish and is already plumbed for a half bath if desired. Downstairs, an unfinished basement with tall ceilings is ready for your ideas. Whether that means a future family room, play area, or home gym. Recent updates include a new furnace, AC, water heater, and water softener, ensuring comfort and peace of mind. Step through the triple sliding doors to discover a spacious backyard that’s perfect for barbecues, backyard games, and quiet evenings under the stars. The included extra lot brings the total property size to just over half an acre and comes with a 24x44 shop. This is the kind of home that feels right from the start, welcoming, well cared for, and ready for the next chapter to unfold.
Home Details
Home Type
- Single Family
Est. Annual Taxes
- $2,006
Year Built
- Built in 1954 | Remodeled
Lot Details
- 0.64 Acre Lot
- Lot Dimensions are 200 x 240
- Corner Lot
- 2 Lots in the community
- 811623010067
Parking
- 2 Car Attached Garage
- Garage Door Opener
- Driveway
Home Design
- Poured Concrete
- Frame Construction
- Asphalt Roof
- Vinyl Siding
- Stick Built Home
Interior Spaces
- 2,112 Sq Ft Home
- 1.5-Story Property
- Ceiling Fan
- Open-Concept Dining Room
- Wood Flooring
- Basement Fills Entire Space Under The House
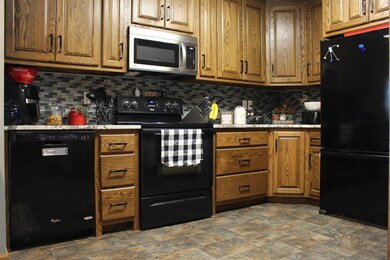
Kitchen
- Range
- Microwave
- Dishwasher
- Kitchen Island
- Disposal
Bedrooms and Bathrooms
- 3 Bedrooms
- Main Floor Bedroom
- Walk-In Closet
- Bathroom on Main Level
Laundry
- Laundry on main level
- Dryer
- Washer
Outdoor Features
- Outdoor Storage
Utilities
- Forced Air Heating and Cooling System
- Heating System Uses Propane
Listing and Financial Details
- Assessor Parcel Number 811623010068
Map
Home Values in the Area
Average Home Value in this Area
Tax History
| Year | Tax Paid | Tax Assessment Tax Assessment Total Assessment is a certain percentage of the fair market value that is determined by local assessors to be the total taxable value of land and additions on the property. | Land | Improvement |
|---|---|---|---|---|
| 2025 | $1,846 | $127,720 | $3,000 | $124,720 |
| 2024 | $1,846 | $113,850 | $2,000 | $111,850 |
| 2023 | $1,508 | $113,850 | $2,000 | $111,850 |
| 2022 | $1,444 | $84,480 | $2,000 | $82,480 |
| 2021 | $1,444 | $84,480 | $2,000 | $82,480 |
| 2020 | $1,352 | $78,380 | $2,000 | $76,380 |
| 2019 | $1,426 | $78,380 | $2,000 | $76,380 |
| 2018 | $1,382 | $76,560 | $0 | $0 |
| 2017 | $1,382 | $66,900 | $0 | $0 |
| 2016 | $1,206 | $66,900 | $0 | $0 |
| 2015 | $1,206 | $67,670 | $0 | $0 |
| 2014 | $1,196 | $67,670 | $0 | $0 |
Property History
| Date | Event | Price | List to Sale | Price per Sq Ft |
|---|---|---|---|---|
| 11/14/2025 11/14/25 | For Sale | $305,000 | -- | $144 / Sq Ft |
Purchase History
| Date | Type | Sale Price | Title Company |
|---|---|---|---|
| Warranty Deed | -- | Boerner & Goldsmith Law Firm P | |
| Deed | $54,500 | None Available | |
| Interfamily Deed Transfer | -- | None Available |
Source: Iowa Great Lakes Board of REALTORS®
MLS Number: 251460
APN: 811623010068
Disclaimer: Certain information contained herein is derived from information provided by parties other than Homes.com. All information provided is deemed reliable, but is not guaranteed to be accurate and should be independently verified.
![]() IDX information is provided exclusively for personal, non-commercial use, and may not be used for any purpose other than to identify prospective properties consumers may be interested in purchasing. Information is deemed reliable but not guaranteed.
IDX information is provided exclusively for personal, non-commercial use, and may not be used for any purpose other than to identify prospective properties consumers may be interested in purchasing. Information is deemed reliable but not guaranteed.
- 201 E 3rd St
- 0 390th Street & Zeller Ave Unit 11563731
- 418 W Washington St
- 301 W South St
- 319 W Jefferson St
- 209 W Monroe St
- 0 S State Rd Unit 211290
- 00 N State Rd
- 229 N State Rd
- 0 160th St
- 209 S Lake St
- 941 6th St
- 116 Vine St
- 716 Lake St
- 0 Daryl St Unit 5423223
- 205 3rd St
- 721 High St
- 221 8th St
- 306 Park St
- 409 Summit St
