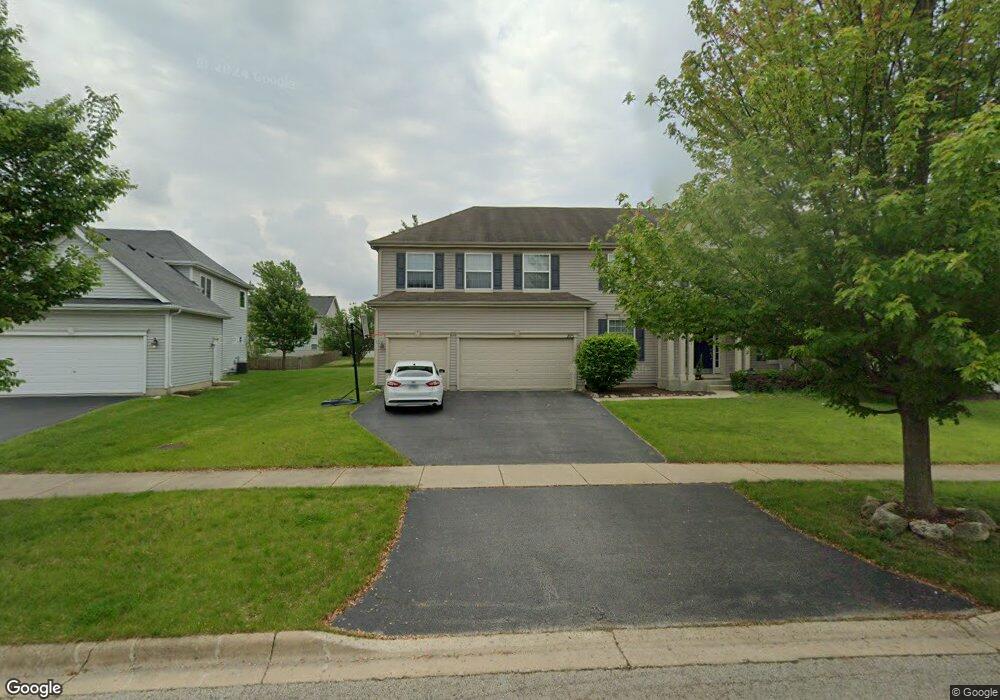
207 Willington Way Oswego, IL 60543
South Oswego NeighborhoodEstimated Value: $384,000 - $535,000
4
Beds
3
Baths
2,490
Sq Ft
$184/Sq Ft
Est. Value
About This Home
This home is located at 207 Willington Way, Oswego, IL 60543 and is currently estimated at $458,255, approximately $184 per square foot. 207 Willington Way is a home located in Kendall County with nearby schools including Southbury Elementary School, Traughber Junior High School, and Oswego High School.
Ownership History
Date
Name
Owned For
Owner Type
Purchase Details
Closed on
Oct 22, 2009
Sold by
Gombert Shirley M
Bought by
Gombert Shirley M
Current Estimated Value
Purchase Details
Closed on
Dec 18, 2008
Sold by
Us Bank National Association
Bought by
Gombert Shirley M
Home Financials for this Owner
Home Financials are based on the most recent Mortgage that was taken out on this home.
Original Mortgage
$161,000
Interest Rate
5.19%
Mortgage Type
Purchase Money Mortgage
Purchase Details
Closed on
Oct 16, 2008
Sold by
Solomon Charles
Bought by
Us Bank National Association
Purchase Details
Closed on
Mar 14, 2005
Sold by
Realen Homes Lp
Bought by
Solomon Charles B and Solomon Rachel B
Home Financials for this Owner
Home Financials are based on the most recent Mortgage that was taken out on this home.
Original Mortgage
$296,496
Interest Rate
7.5%
Mortgage Type
Fannie Mae Freddie Mac
Create a Home Valuation Report for This Property
The Home Valuation Report is an in-depth analysis detailing your home's value as well as a comparison with similar homes in the area
Home Values in the Area
Average Home Value in this Area
Purchase History
| Date | Buyer | Sale Price | Title Company |
|---|---|---|---|
| Gombert Shirley M | -- | None Available | |
| Gombert Shirley M | $230,000 | First American Title | |
| Us Bank National Association | -- | None Available | |
| Solomon Charles B | $312,500 | Chicago Title Insurance Co |
Source: Public Records
Mortgage History
| Date | Status | Borrower | Loan Amount |
|---|---|---|---|
| Previous Owner | Gombert Shirley M | $161,000 | |
| Previous Owner | Solomon Charles B | $296,496 |
Source: Public Records
Tax History Compared to Growth
Tax History
| Year | Tax Paid | Tax Assessment Tax Assessment Total Assessment is a certain percentage of the fair market value that is determined by local assessors to be the total taxable value of land and additions on the property. | Land | Improvement |
|---|---|---|---|---|
| 2024 | $10,255 | $127,434 | $39,776 | $87,658 |
| 2023 | $9,434 | $111,784 | $34,891 | $76,893 |
| 2022 | $9,434 | $104,471 | $32,608 | $71,863 |
| 2021 | $8,886 | $94,974 | $29,644 | $65,330 |
| 2020 | $8,309 | $87,939 | $27,448 | $60,491 |
| 2019 | $8,061 | $83,982 | $27,448 | $56,534 |
| 2018 | $8,759 | $86,516 | $28,276 | $58,240 |
| 2017 | $8,869 | $86,516 | $28,276 | $58,240 |
| 2016 | $8,530 | $82,006 | $26,802 | $55,204 |
| 2015 | $8,602 | $78,852 | $25,771 | $53,081 |
| 2014 | -- | $74,388 | $24,312 | $50,076 |
| 2013 | -- | $74,388 | $24,312 | $50,076 |
Source: Public Records
Map
Nearby Homes
- 704 Pomfret Ct
- 420 Bower Ln
- 703 Pomfret Ct
- 450 Bower Ln
- 452 Bower Ln
- 454 Bower Ln
- 633 Mansfield Way
- 860 Preston Ln
- 858 Preston Ln
- Lyndale Plan at Southbury
- 215 Willington Way
- Hudson Plan at Southbury
- Essex Plan at Southbury
- 856 Preston Ln
- 555 Litchfield Way
- 739 Alberta Ave
- 737 Alberta Ave
- 735 Alberta Ave
- 621 Mansfield Way
- 734 Alberta Ave
- 205 Willington Way
- 209 Willington Way
- 410 Bower Ln
- 408 Bower Ln
- 203 Willington Way
- 412 Bower Ln
- 406 Bower Ln
- 700 Pomfret Ct
- 204 Willington Way
- 202 Willington Way
- 414 Bower Ln
- 702 Pomfret Ct
- 404 Bower Ln
- 206 Willington Way
- 201 Willington Way
- 200 Willington Way
- 402 Bower Ln
- 416 Bower Ln
- 416 Bower Ln Unit 803
- 208 Willington Way