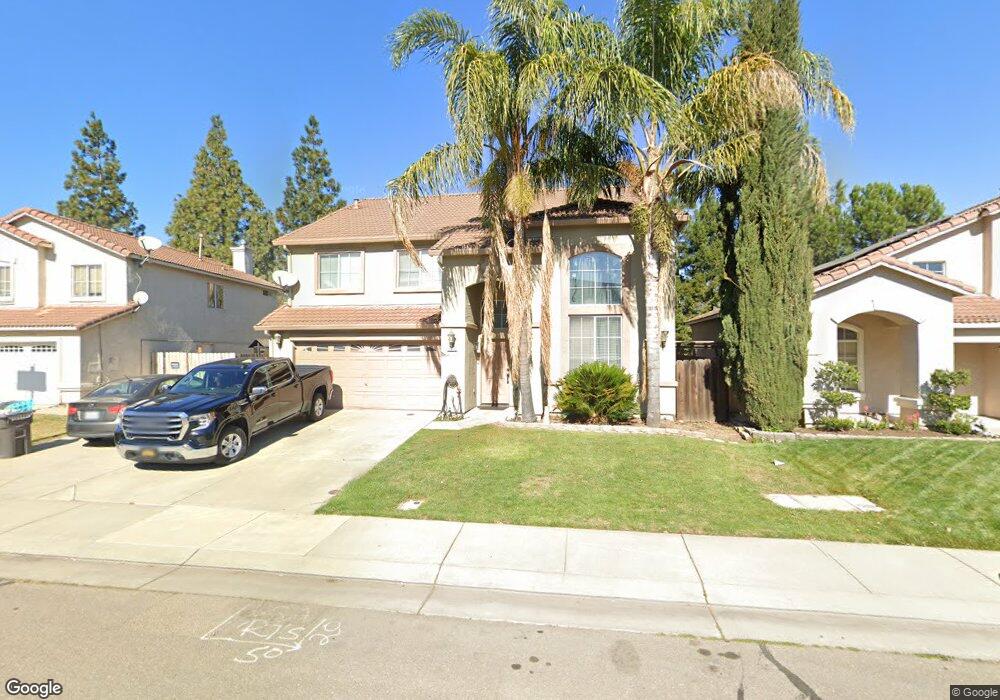
2070 Gordon Verner Cir Stockton, CA 95206
Weston Ranch NeighborhoodEstimated Value: $430,000 - $569,000
4
Beds
3
Baths
2,533
Sq Ft
$209/Sq Ft
Est. Value
About This Home
This home is located at 2070 Gordon Verner Cir, Stockton, CA 95206 and is currently estimated at $530,372, approximately $209 per square foot. 2070 Gordon Verner Cir is a home located in San Joaquin County with nearby schools including August Knodt Elementary School and Weston Ranch High School.
Ownership History
Date
Name
Owned For
Owner Type
Purchase Details
Closed on
Aug 29, 2002
Sold by
Jaimes Israel and Jaimes Mary
Bought by
Elizondo Cassandra
Current Estimated Value
Home Financials for this Owner
Home Financials are based on the most recent Mortgage that was taken out on this home.
Original Mortgage
$242,207
Outstanding Balance
$125,436
Interest Rate
9.62%
Estimated Equity
$404,936
Purchase Details
Closed on
Dec 6, 2000
Sold by
Hansen Jesse P and Hansen Weena M
Bought by
Jaimes Israel and Jaimes Mary
Home Financials for this Owner
Home Financials are based on the most recent Mortgage that was taken out on this home.
Original Mortgage
$247,000
Interest Rate
7.67%
Purchase Details
Closed on
Nov 24, 1997
Sold by
R E Development Corp
Bought by
Hansen Jesse P and Hansen Weena M
Home Financials for this Owner
Home Financials are based on the most recent Mortgage that was taken out on this home.
Original Mortgage
$159,109
Interest Rate
7.31%
Mortgage Type
VA
Create a Home Valuation Report for This Property
The Home Valuation Report is an in-depth analysis detailing your home's value as well as a comparison with similar homes in the area
Home Values in the Area
Average Home Value in this Area
Purchase History
| Date | Buyer | Sale Price | Title Company |
|---|---|---|---|
| Elizondo Cassandra | $285,000 | Fidelity National Title Ins | |
| Jaimes Israel | $261,000 | Fidelity National Title Co | |
| Hansen Jesse P | $156,000 | Old Republic Title Company |
Source: Public Records
Mortgage History
| Date | Status | Borrower | Loan Amount |
|---|---|---|---|
| Open | Elizondo Cassandra | $242,207 | |
| Previous Owner | Jaimes Israel | $247,000 | |
| Previous Owner | Hansen Jesse P | $159,109 |
Source: Public Records
Tax History Compared to Growth
Tax History
| Year | Tax Paid | Tax Assessment Tax Assessment Total Assessment is a certain percentage of the fair market value that is determined by local assessors to be the total taxable value of land and additions on the property. | Land | Improvement |
|---|---|---|---|---|
| 2025 | $5,569 | $412,675 | $123,099 | $289,576 |
| 2024 | $5,397 | $404,585 | $120,686 | $283,899 |
| 2023 | $5,213 | $396,653 | $118,320 | $278,333 |
| 2022 | $5,111 | $388,876 | $116,000 | $272,876 |
| 2021 | $5,030 | $381,252 | $113,726 | $267,526 |
| 2020 | $4,837 | $377,343 | $112,560 | $264,783 |
| 2019 | $4,766 | $369,945 | $110,353 | $259,592 |
| 2018 | $4,719 | $362,692 | $108,190 | $254,502 |
| 2017 | $4,304 | $325,000 | $97,000 | $228,000 |
| 2016 | $3,990 | $303,000 | $90,000 | $213,000 |
| 2014 | $4,436 | $256,000 | $77,000 | $179,000 |
Source: Public Records
Map
Nearby Homes
- 2079 Gordon Verner Cir
- 1890 Gordon Verner Cir
- 3779 Zeally Ln
- 3745 Wild Rose Ln
- 2215 Dune Place
- 1526 Kimiyo St
- 2402 Sailboat Ct
- 3738 Luisa Kayasso Ln
- 3412 Shogoro Ln
- 3330 Konig Ct
- 1903 Picasso Way
- 2428 Shell Ct
- 1929 Picasso Way
- 4150 Degas Ct
- 2115 Picasso Way
- 1914 Picasso Way
- 1817 Germain Ln
- 4135 Roma Ln
- 2625 Crestmore Cir
- 4331 Eiffel Dr
- 2068 Gordon Verner Cir
- 2074 Gordon Verner Cir
- 2064 Gordon Verner Cir
- 2076 Gordon Verner Cir
- 2071 Gordon Verner Cir
- 2067 Gordon Verner Cir
- 2075 Gordon Verner Cir
- 2062 Gordon Verner Cir
- 2065 Gordon Verner Cir
- 1916 Sandpebble St
- 1904 Sandpebble St
- 2058 Gordon Verner Cir
- 2061 Gordon Verner Cir
- 3377 Gaswell Ln
- 1928 Sandpebble St
- 2083 Gordon Verner Cir
- 3513 Zane Grey Ct
- 1921 Forthright Ct
- 1940 Sandpebble St
- 1802 Gordon Verner Cir