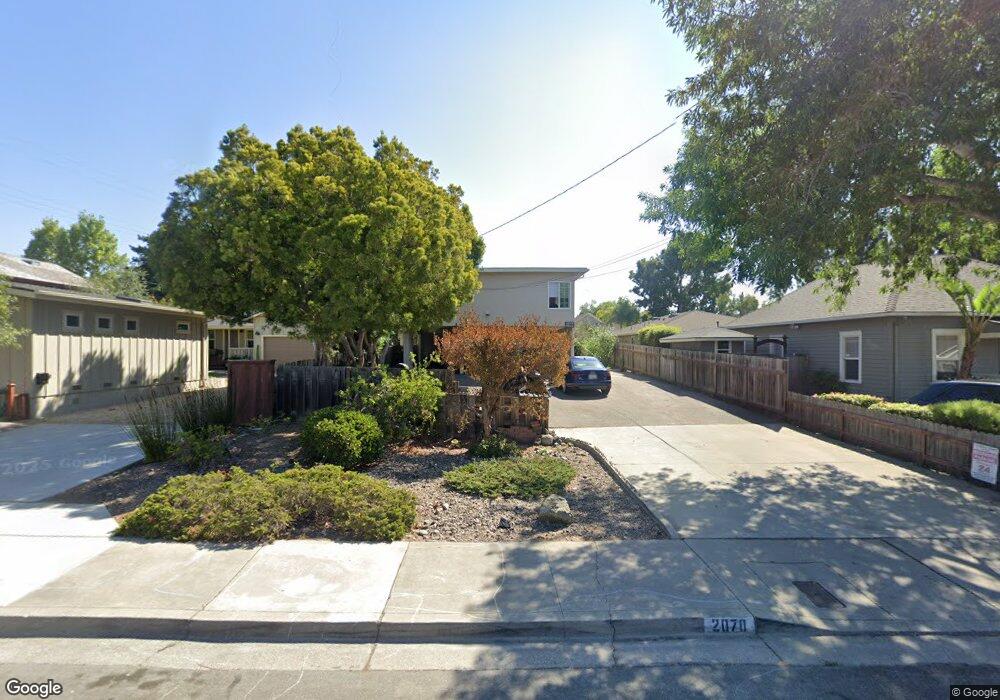
2070 Price St San Luis Obispo, CA 93401
Higuera NeighborhoodEstimated Value: $1,698,000 - $1,745,000
6
Beds
3
Baths
2,940
Sq Ft
$584/Sq Ft
Est. Value
About This Home
This home is located at 2070 Price St, San Luis Obispo, CA 93401 and is currently estimated at $1,717,333, approximately $584 per square foot. 2070 Price St is a home located in San Luis Obispo County with nearby schools including Laguna Middle School, San Luis Obispo High School, and San Luis Obispo Classical Academy.
Ownership History
Date
Name
Owned For
Owner Type
Purchase Details
Closed on
Jul 29, 2024
Sold by
Bostrom Family Limited Partnership
Bought by
Bostrom Family Trust and Bostrom
Current Estimated Value
Purchase Details
Closed on
May 29, 2008
Sold by
Bostrom Robert M and Bostrom Ruth D
Bought by
Porter Ann Marie and Bostrom Robert Howard
Purchase Details
Closed on
May 21, 2008
Sold by
Porter Ann Marie and Bostrom Robert Howard
Bought by
Bostrom Family Limited Partnership
Purchase Details
Closed on
May 8, 2007
Sold by
Bostrom Robert M and Bostrom Ruth D
Bought by
Porter Ann Marie and Bostrom Robert Howard
Purchase Details
Closed on
Mar 31, 2006
Sold by
Porter Ann Marie and Bostrom Robert Howard
Bought by
The Bostrom Family Lp
Purchase Details
Closed on
Mar 24, 2006
Sold by
Bostrom Robert M and Bostrom Ruth D
Bought by
The Bostrom Family Lp
Create a Home Valuation Report for This Property
The Home Valuation Report is an in-depth analysis detailing your home's value as well as a comparison with similar homes in the area
Home Values in the Area
Average Home Value in this Area
Purchase History
| Date | Buyer | Sale Price | Title Company |
|---|---|---|---|
| Bostrom Family Trust | -- | None Listed On Document | |
| Porter Ann Marie | -- | None Available | |
| Bostrom Robert M | -- | None Available | |
| Bostrom Family Limited Partnership | -- | None Available | |
| Porter Ann Marie | -- | None Available | |
| Bostrom Robert M | -- | None Available | |
| The Bostrom Family Lp | -- | None Available | |
| The Bostrom Family Lp | -- | None Available | |
| Porter Ann Marie | -- | None Available | |
| Bostrom Robert M | -- | None Available |
Source: Public Records
Tax History Compared to Growth
Tax History
| Year | Tax Paid | Tax Assessment Tax Assessment Total Assessment is a certain percentage of the fair market value that is determined by local assessors to be the total taxable value of land and additions on the property. | Land | Improvement |
|---|---|---|---|---|
| 2025 | $18,118 | $1,623,646 | $865,945 | $757,701 |
| 2024 | $17,800 | $1,591,811 | $848,966 | $742,845 |
| 2023 | $17,800 | $1,560,600 | $832,320 | $728,280 |
| 2022 | $5,082 | $432,309 | $204,911 | $227,398 |
| 2021 | $4,972 | $423,834 | $200,894 | $222,940 |
| 2020 | $4,919 | $419,490 | $198,835 | $220,655 |
| 2019 | $4,856 | $411,266 | $194,937 | $216,329 |
| 2018 | $4,770 | $403,203 | $191,115 | $212,088 |
| 2017 | $4,673 | $395,298 | $187,368 | $207,930 |
| 2016 | $4,457 | $387,548 | $183,695 | $203,853 |
| 2015 | $4,092 | $381,727 | $180,936 | $200,791 |
| 2014 | $3,908 | $374,250 | $177,392 | $196,858 |
Source: Public Records
Map
Nearby Homes
- 2220 Exposition Dr Unit 94
- 1407 Beach St
- 145 South St Unit a44
- 145 South St Unit c2
- 145 South St Unit A21
- 145 South St Unit A-27
- 145 South St Unit A41
- 145 South St Unit A28
- 717 Islay St
- 274 Higuera St Unit 8
- 274 Higuera St Unit 9
- 274 Higuera St Unit 17
- 2357 Banderola Ct
- 171 Brook St
- 581 Higuera St Unit 308
- 581 Higuera St Unit 207
- 581 Higuera St Unit 302
- 581 Higuera St Unit 301
- 581 Higuera St Unit 201
- 581 Higuera St Unit 307
- 352 Sandercock St
- 2062 Price St
- 362 Sandercock St
- 2048 Price St
- 373 High St
- 2065 Harris St
- 2031 Harris St
- 2085 Harris St Unit 2
- 2085 Harris St
- 375 High St
- 363 High St
- 355 Sandercock St
- 2057 Price St
- 377 High St
- 365 Sandercock St
- 342 Sandercock St
- 355 High St
- 2065 Price St
- 373 Sandercock St
- 385 High St