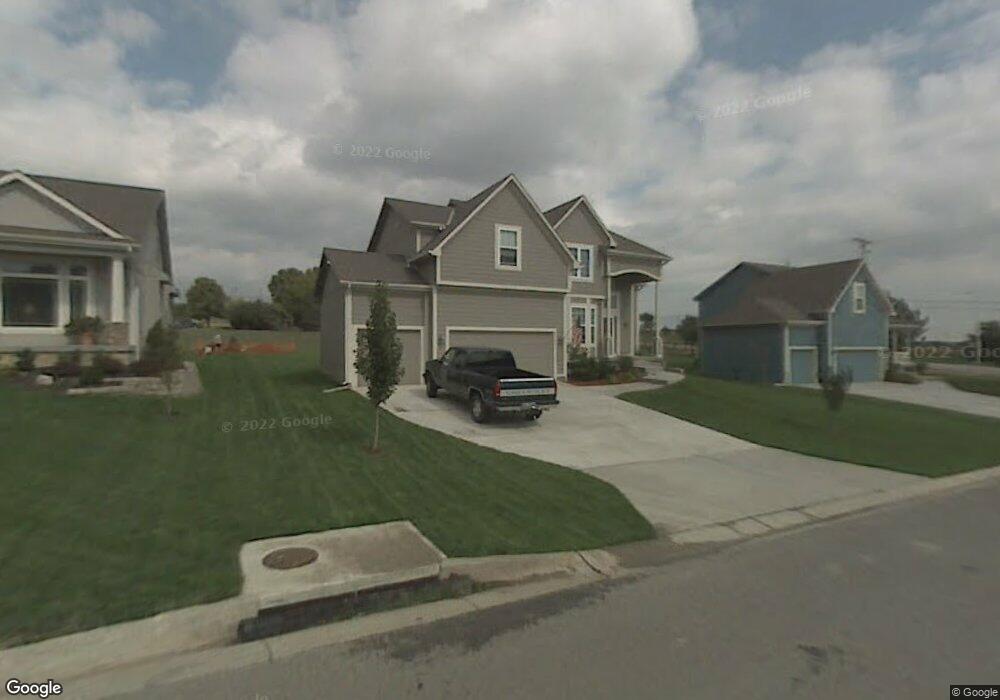
20704 W 48th St Shawnee, KS 66218
Estimated Value: $460,000 - $519,000
4
Beds
4
Baths
2,666
Sq Ft
$185/Sq Ft
Est. Value
About This Home
This home is located at 20704 W 48th St, Shawnee, KS 66218 and is currently estimated at $492,934, approximately $184 per square foot. 20704 W 48th St is a home located in Johnson County with nearby schools including Riverview Elementary School, Mill Creek Middle School, and Mill Valley High School.
Ownership History
Date
Name
Owned For
Owner Type
Purchase Details
Closed on
Dec 4, 2006
Sold by
Prudential Relocation Inc
Bought by
Jackson John A and Jackson Lynn M
Current Estimated Value
Home Financials for this Owner
Home Financials are based on the most recent Mortgage that was taken out on this home.
Original Mortgage
$204,000
Outstanding Balance
$121,222
Interest Rate
6.2%
Mortgage Type
New Conventional
Estimated Equity
$371,712
Purchase Details
Closed on
Jun 16, 2005
Sold by
Highland Park Builders Llc
Bought by
Benson Roy I and Benson Eileen M
Home Financials for this Owner
Home Financials are based on the most recent Mortgage that was taken out on this home.
Original Mortgage
$203,000
Interest Rate
5.67%
Mortgage Type
New Conventional
Create a Home Valuation Report for This Property
The Home Valuation Report is an in-depth analysis detailing your home's value as well as a comparison with similar homes in the area
Home Values in the Area
Average Home Value in this Area
Purchase History
| Date | Buyer | Sale Price | Title Company |
|---|---|---|---|
| Jackson John A | -- | Chicago Title Ins Co | |
| Benson Roy I | -- | Midwest Title Co Inc |
Source: Public Records
Mortgage History
| Date | Status | Borrower | Loan Amount |
|---|---|---|---|
| Open | Jackson John A | $204,000 | |
| Previous Owner | Benson Roy I | $203,000 |
Source: Public Records
Tax History Compared to Growth
Tax History
| Year | Tax Paid | Tax Assessment Tax Assessment Total Assessment is a certain percentage of the fair market value that is determined by local assessors to be the total taxable value of land and additions on the property. | Land | Improvement |
|---|---|---|---|---|
| 2024 | $5,622 | $48,346 | $10,773 | $37,573 |
| 2023 | $5,635 | $47,920 | $9,791 | $38,129 |
| 2022 | $5,135 | $42,791 | $8,902 | $33,889 |
| 2021 | $5,091 | $40,790 | $8,481 | $32,309 |
| 2020 | $4,683 | $37,168 | $8,481 | $28,687 |
| 2019 | $4,443 | $34,742 | $7,343 | $27,399 |
| 2018 | $4,483 | $34,742 | $7,343 | $27,399 |
| 2017 | $4,569 | $34,558 | $6,385 | $28,173 |
| 2016 | $4,442 | $33,178 | $5,808 | $27,370 |
| 2015 | $4,354 | $31,948 | $5,808 | $26,140 |
| 2013 | -- | $29,648 | $5,808 | $23,840 |
Source: Public Records
Map
Nearby Homes
- 5015 Millbrook St
- 4754 Lakecrest Dr
- 21222 W 48th St
- 4531 Woodstock St
- 20823 W 45th Terrace
- 21408 W 50th St
- 4713 Lone Elm
- 21525 W 51st St
- 5311 Brownridge Dr
- 5405 Lakecrest Dr
- 5307 Noble St
- 22014 W 47th Terrace
- 21804 W 52nd Terrace
- 22014 W 51st St
- 5116 Payne St
- 21624 W 53rd Terrace
- 5206 Round Prairie St
- 21217 W 55th Terrace
- 22115 W 51st Terrace
- 738 S 9th St
- 20708 W 48th St
- 20700 W 48th St
- 20802 W 48th St
- 20705 W 48th St
- 20701 W 48th St
- 20709 W 48th St
- 20803 W 48th St
- 20810 W 48th St
- 20807 W 48th St
- 20706 W 49th St
- 20710 W 49th St
- 20702 W 49th St
- 20804 W 49th St
- 4820 Woodland Dr
- 20808 W 49th St
- 20811 W 48th St
- 20904 W 48th St
- 20812 W 49th St
- 20903 W 48th St
- 20908 W 48th St