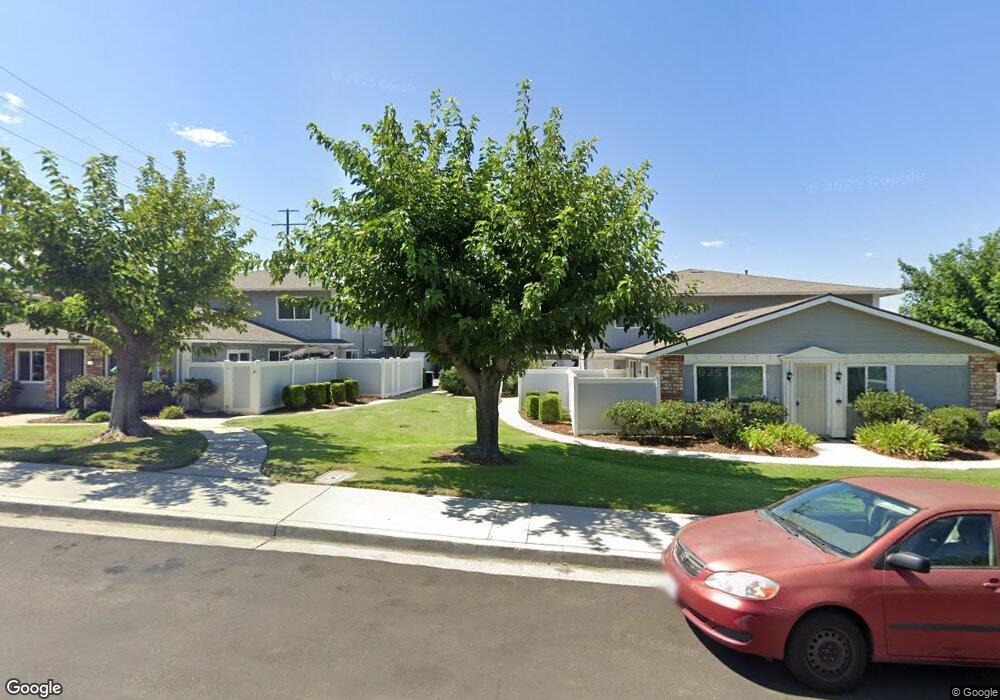
20710 Dot St Santa Clarita, CA 91350
Saugus NeighborhoodEstimated Value: $345,944 - $381,000
2
Beds
1
Bath
799
Sq Ft
$451/Sq Ft
Est. Value
About This Home
This home is located at 20710 Dot St, Santa Clarita, CA 91350 and is currently estimated at $359,986, approximately $450 per square foot. 20710 Dot St is a home located in Los Angeles County with nearby schools including Rosedell Elementary School, Arroyo Seco Junior High School, and Saugus High School.
Ownership History
Date
Name
Owned For
Owner Type
Purchase Details
Closed on
Aug 6, 2013
Sold by
Pepi Eugene F and Pepi Melody D
Bought by
Pepi Eugene F and Pepi Melody D
Current Estimated Value
Purchase Details
Closed on
Dec 14, 2009
Sold by
Waters Hope
Bought by
Pepi Eugene F and Pepi Melody D
Home Financials for this Owner
Home Financials are based on the most recent Mortgage that was taken out on this home.
Original Mortgage
$73,500
Interest Rate
4.78%
Mortgage Type
New Conventional
Purchase Details
Closed on
Jan 18, 2007
Sold by
Acuna Hilda A
Bought by
Waters Hope
Home Financials for this Owner
Home Financials are based on the most recent Mortgage that was taken out on this home.
Original Mortgage
$208,000
Interest Rate
7.49%
Mortgage Type
Purchase Money Mortgage
Purchase Details
Closed on
Oct 4, 2000
Sold by
Porter Edward O and Porter Judith
Bought by
Acuna Hilda A
Create a Home Valuation Report for This Property
The Home Valuation Report is an in-depth analysis detailing your home's value as well as a comparison with similar homes in the area
Home Values in the Area
Average Home Value in this Area
Purchase History
| Date | Buyer | Sale Price | Title Company |
|---|---|---|---|
| Pepi Eugene F | -- | None Available | |
| Pepi Eugene F | $105,000 | Usa National Title Company | |
| Waters Hope | $260,000 | First Southwestern Title Co | |
| Acuna Hilda A | $83,500 | Southland Title |
Source: Public Records
Mortgage History
| Date | Status | Borrower | Loan Amount |
|---|---|---|---|
| Closed | Pepi Eugene F | $73,500 | |
| Previous Owner | Waters Hope | $208,000 |
Source: Public Records
Tax History Compared to Growth
Tax History
| Year | Tax Paid | Tax Assessment Tax Assessment Total Assessment is a certain percentage of the fair market value that is determined by local assessors to be the total taxable value of land and additions on the property. | Land | Improvement |
|---|---|---|---|---|
| 2025 | $2,301 | $135,517 | $27,097 | $108,420 |
| 2024 | $2,301 | $132,861 | $26,566 | $106,295 |
| 2023 | $2,216 | $130,257 | $26,046 | $104,211 |
| 2022 | $2,217 | $127,704 | $25,536 | $102,168 |
| 2021 | $2,179 | $125,201 | $25,036 | $100,165 |
| 2019 | $2,108 | $121,490 | $24,295 | $97,195 |
| 2018 | $2,049 | $119,109 | $23,819 | $95,290 |
| 2016 | $1,923 | $114,486 | $22,895 | $91,591 |
| 2015 | $1,853 | $112,768 | $22,552 | $90,216 |
| 2014 | $1,825 | $110,560 | $22,111 | $88,449 |
Source: Public Records
Map
Nearby Homes
- 28016 Robin Ave
- 20715 Dot St
- 20558 Romar Ln
- 28144 Alaminos Dr
- 28011 Charles Dr
- 27828 Parkvale Dr
- 20623 Russ Jay St
- 20906 Susan Carole Dr
- 0 Plum Canyon Rd
- 21045 Susan Carole Dr
- 20376 Lisa Gail Dr
- 20220 Arthur Ct
- 21123 Avenida de Sonrisa
- 20818 Benz Rd
- 20047 Holly Dr
- 28225 Clementine Dr
- 20643 Calhaven Dr
- 27620 Susan Beth Way Unit A
- 21103 Cross Creek Dr
- 27641 Sutters Pointe Dr
- 28034 Robin Ave Unit 42
- 20712 Dot St Unit 50
- 28038 Robin Ave Unit 48
- 28040 Robin Ave
- 28034 Robin Ave
- 20708 Dot St
- 20706 Dot St
- 20702 Dot St
- 20704 Dot St
- 28030 Robin Ave
- 28044 Robin Ave
- 20716 Dot St
- 28042 Robin Ave Unit 45
- 28032 Robin Ave
- 28028 Robin Ave
- 28063 Robin Ave Unit 167
- 20703 Dot St Unit 61
- 20713 Dot St
- 20701 Dot St
- 28071 Robin Ave Unit 164