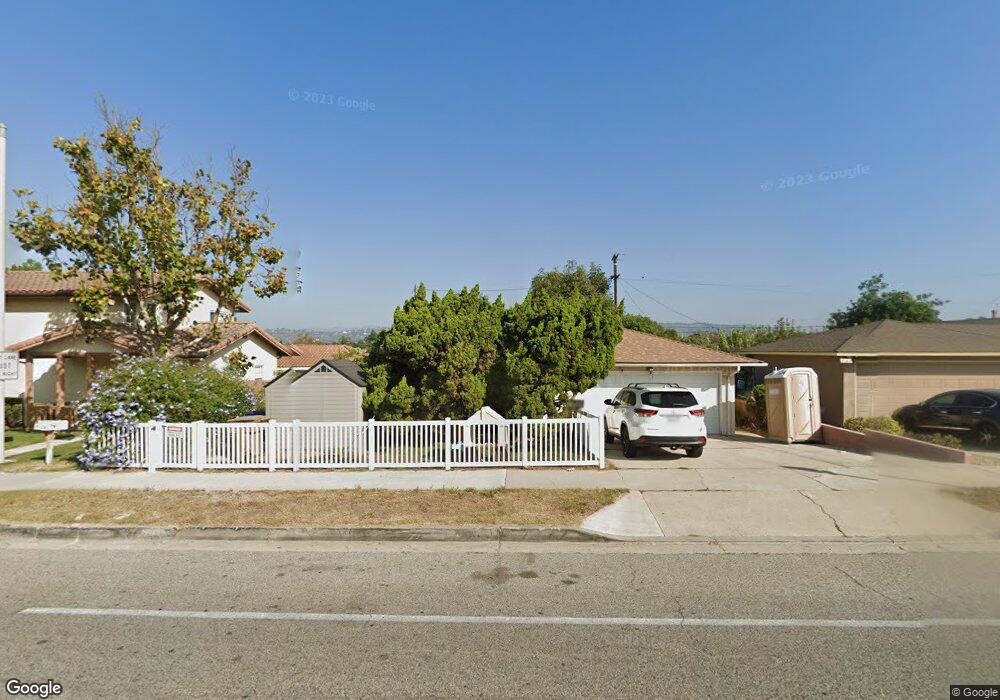
2073 E Daily Dr Camarillo, CA 93010
Estimated Value: $679,000 - $1,157,000
Studio
--
Bath
1,536
Sq Ft
$557/Sq Ft
Est. Value
About This Home
This home is located at 2073 E Daily Dr, Camarillo, CA 93010 and is currently estimated at $855,156, approximately $556 per square foot. 2073 E Daily Dr is a home located in Ventura County with nearby schools including Dos Caminos Elementary School, Monte Vista Middle School, and Adolfo Camarillo High School.
Ownership History
Date
Name
Owned For
Owner Type
Purchase Details
Closed on
Nov 1, 2017
Sold by
Soroudi Steven
Bought by
Tle Association Llc
Current Estimated Value
Purchase Details
Closed on
Apr 18, 2017
Sold by
Soroudi Pantea A
Bought by
Soroudi Steven
Purchase Details
Closed on
Apr 14, 2017
Sold by
Tle Associates Llc
Bought by
Soroudi Steven
Purchase Details
Closed on
Jul 14, 2011
Sold by
Soroudi Yousef and Soroudi Pouran
Bought by
Tle Associates Llc
Purchase Details
Closed on
Jun 10, 2003
Sold by
Soroudi Yousef and Soroudi Pouran Y
Bought by
Soroudi Yousef and Soroudi Pouran Y
Purchase Details
Closed on
Dec 17, 1998
Sold by
Jps Family and Soroudi Yousef
Bought by
Soroudi Yousef and Soroudi Pouran
Home Financials for this Owner
Home Financials are based on the most recent Mortgage that was taken out on this home.
Original Mortgage
$127,400
Interest Rate
6.91%
Create a Home Valuation Report for This Property
The Home Valuation Report is an in-depth analysis detailing your home's value as well as a comparison with similar homes in the area
Home Values in the Area
Average Home Value in this Area
Purchase History
| Date | Buyer | Sale Price | Title Company |
|---|---|---|---|
| Tle Association Llc | -- | None Available | |
| Soroudi Steven | -- | Fidelity National Title | |
| Soroudi Steven | -- | Fidelity National Title | |
| Tle Associates Llc | -- | None Available | |
| Soroudi Yousef | -- | -- | |
| Soroudi Yousef | -- | United Title Company |
Source: Public Records
Mortgage History
| Date | Status | Borrower | Loan Amount |
|---|---|---|---|
| Previous Owner | Soroudi Yousef | $127,400 |
Source: Public Records
Tax History
| Year | Tax Paid | Tax Assessment Tax Assessment Total Assessment is a certain percentage of the fair market value that is determined by local assessors to be the total taxable value of land and additions on the property. | Land | Improvement |
|---|---|---|---|---|
| 2025 | $2,653 | $233,975 | $78,343 | $155,632 |
| 2024 | $2,653 | $229,388 | $76,807 | $152,581 |
| 2023 | $2,560 | $224,891 | $75,301 | $149,590 |
| 2022 | $2,551 | $220,482 | $73,825 | $146,657 |
| 2021 | $2,461 | $216,159 | $72,377 | $143,782 |
| 2020 | $2,452 | $213,944 | $71,636 | $142,308 |
| 2019 | $2,440 | $209,750 | $70,232 | $139,518 |
| 2018 | $2,395 | $205,638 | $68,855 | $136,783 |
| 2017 | $2,257 | $201,606 | $67,505 | $134,101 |
| 2016 | $2,205 | $197,654 | $66,182 | $131,472 |
| 2015 | $2,181 | $194,688 | $65,189 | $129,499 |
| 2014 | $2,132 | $190,876 | $63,913 | $126,963 |
Source: Public Records
Map
Nearby Homes
- 1910 Colonia Place
- 2854 Via Monte Mar
- 425 Baja Ct
- 647 Arneill Rd
- 62 + Calleguas
- 1610 Edgewater Ln
- 1682 Darnell Ct
- 1944 Hayden St
- 1623 Regent St
- 239 Cartagena St
- 1067 Bordeaux Ave
- 2174 Wilcox St
- 1150 Ventura Blvd Unit 77
- 1150 Ventura Blvd Unit 95
- 1150 Ventura Blvd Unit SPC 125
- 1150 Ventura Blvd Unit 110
- 1150 Ventura Blvd Unit 62
- 1143 Bordeaux Ave
- 533 Via Vallarta
- 537 Via Vallarta
Your Personal Tour Guide
Ask me questions while you tour the home.