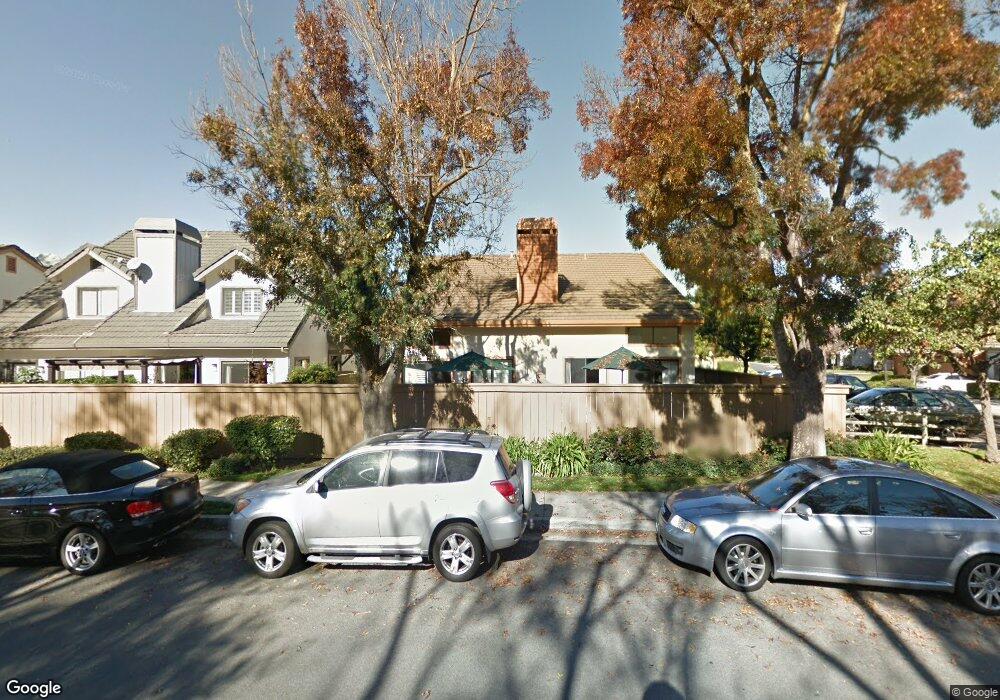
2074 Wente Way San Jose, CA 95125
Willow Glen NeighborhoodEstimated Value: $930,503 - $1,018,000
1
Bed
2
Baths
1,080
Sq Ft
$893/Sq Ft
Est. Value
About This Home
This home is located at 2074 Wente Way, San Jose, CA 95125 and is currently estimated at $964,376, approximately $892 per square foot. 2074 Wente Way is a home located in Santa Clara County with nearby schools including Del Mar High School, Blackford Elementary, and Sherman Oaks Elementary School.
Ownership History
Date
Name
Owned For
Owner Type
Purchase Details
Closed on
Jan 8, 2017
Sold by
Nelson Dea M and The Dea M Nelson 2011 Revocabl
Bought by
Nelson Robin T
Current Estimated Value
Home Financials for this Owner
Home Financials are based on the most recent Mortgage that was taken out on this home.
Original Mortgage
$474,000
Outstanding Balance
$388,370
Interest Rate
3.92%
Mortgage Type
Commercial
Estimated Equity
$576,006
Purchase Details
Closed on
Jan 11, 2012
Sold by
Nelson Dea M
Bought by
Nelson Dea M
Home Financials for this Owner
Home Financials are based on the most recent Mortgage that was taken out on this home.
Original Mortgage
$202,500
Interest Rate
3.93%
Mortgage Type
New Conventional
Purchase Details
Closed on
Oct 3, 2011
Sold by
Nelson Dea M
Bought by
Nelson Dea M
Purchase Details
Closed on
Jun 2, 1999
Sold by
Nelson Carol A
Bought by
Nelson Dea M
Home Financials for this Owner
Home Financials are based on the most recent Mortgage that was taken out on this home.
Original Mortgage
$212,000
Interest Rate
6.84%
Create a Home Valuation Report for This Property
The Home Valuation Report is an in-depth analysis detailing your home's value as well as a comparison with similar homes in the area
Home Values in the Area
Average Home Value in this Area
Purchase History
| Date | Buyer | Sale Price | Title Company |
|---|---|---|---|
| Nelson Robin T | $529,000 | None Available | |
| Nelson Dea M | -- | First American Title Company | |
| Nelson Dea M | -- | None Available | |
| Nelson Dea M | $295,000 | Old Republic Title Company |
Source: Public Records
Mortgage History
| Date | Status | Borrower | Loan Amount |
|---|---|---|---|
| Open | Nelson Robin T | $474,000 | |
| Closed | Nelson Dea M | $202,500 | |
| Closed | Nelson Dea M | $212,000 |
Source: Public Records
Tax History Compared to Growth
Tax History
| Year | Tax Paid | Tax Assessment Tax Assessment Total Assessment is a certain percentage of the fair market value that is determined by local assessors to be the total taxable value of land and additions on the property. | Land | Improvement |
|---|---|---|---|---|
| 2025 | $12,464 | $921,636 | $460,818 | $460,818 |
| 2024 | $12,464 | $903,566 | $451,783 | $451,783 |
| 2023 | $12,231 | $885,850 | $442,925 | $442,925 |
| 2022 | $12,141 | $868,482 | $434,241 | $434,241 |
| 2021 | $11,906 | $851,454 | $425,727 | $425,727 |
| 2020 | $11,596 | $842,724 | $421,362 | $421,362 |
| 2019 | $11,450 | $826,200 | $413,100 | $413,100 |
| 2018 | $6,155 | $406,439 | $227,330 | $179,109 |
| 2017 | $6,072 | $398,471 | $222,873 | $175,598 |
| 2016 | $5,742 | $390,658 | $218,503 | $172,155 |
| 2015 | $5,660 | $384,791 | $215,221 | $169,570 |
| 2014 | $5,042 | $377,255 | $211,006 | $166,249 |
Source: Public Records
Map
Nearby Homes
- 1874 Huxley Ct
- 1932 Huxley Ct
- 1831 Ashmeade Ct
- 1721 Braddock Ct
- 1751 Braddock Ct
- 2043 Sonador Commons
- 2067 Sonador Commons
- 90 Quail Hollow Dr Unit 90
- 1405 Allegado Alley Unit 86
- 1990 Southwest Expy
- 177 Quail Hollow Dr Unit 117
- 26 Quail Hollow Dr Unit 26
- 138 Quail Hollow Dr Unit 138
- 1445 S Bascom Ave Unit 47
- 1566 Stokes St
- 1182 Leigh Ave
- 160 Quail Hollow Dr Unit 160A
- 1515 Rhinecliff Way
- 912 Campisi Way Unit 115
- 912 Campisi Way Unit 201