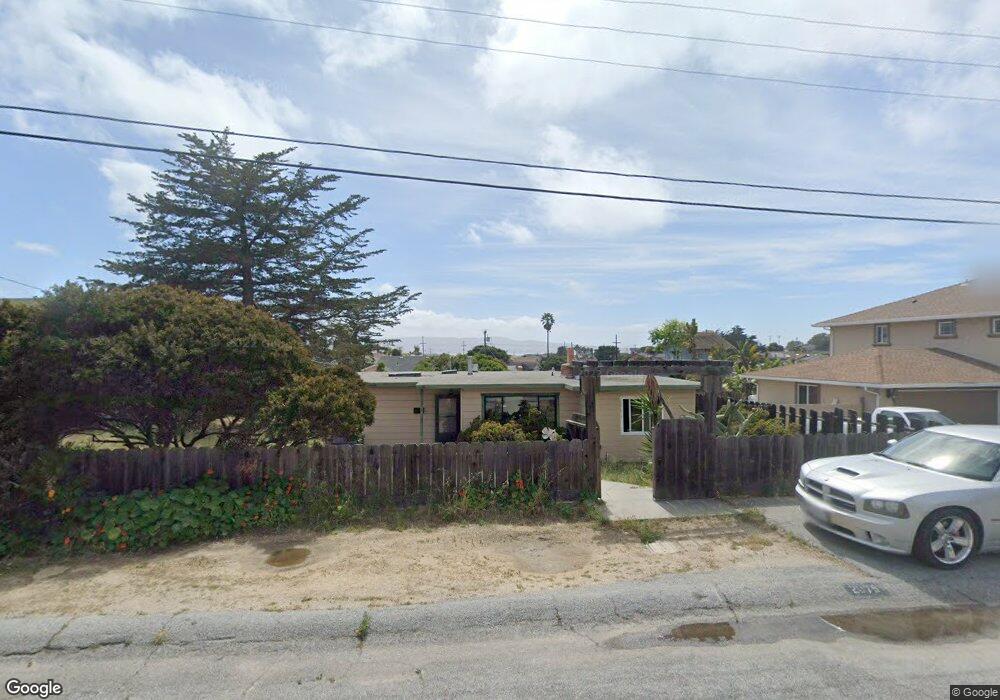
2075 Cross St Seaside, CA 93955
Estimated Value: $644,072 - $790,000
2
Beds
1
Bath
829
Sq Ft
$856/Sq Ft
Est. Value
About This Home
This home is located at 2075 Cross St, Seaside, CA 93955 and is currently estimated at $710,018, approximately $856 per square foot. 2075 Cross St is a home located in Monterey County with nearby schools including Ord Terrace Elementary School, Seaside Middle School, and Seaside High School.
Ownership History
Date
Name
Owned For
Owner Type
Purchase Details
Closed on
Aug 21, 2025
Sold by
Loorz Thomas P
Bought by
Thomas P Loorz Trust and Loorz
Current Estimated Value
Home Financials for this Owner
Home Financials are based on the most recent Mortgage that was taken out on this home.
Original Mortgage
$100,000
Outstanding Balance
$99,486
Interest Rate
6.75%
Mortgage Type
Credit Line Revolving
Estimated Equity
$610,532
Purchase Details
Closed on
Jun 23, 2023
Sold by
Loorz Thomas P
Bought by
Thomas P Loorz Trust and Loorz
Home Financials for this Owner
Home Financials are based on the most recent Mortgage that was taken out on this home.
Original Mortgage
$30,000
Interest Rate
6.39%
Mortgage Type
Credit Line Revolving
Purchase Details
Closed on
Oct 20, 2006
Sold by
Loorz Thomas P
Bought by
Loorz Thomas P and The Thomas P Loorz Trust
Home Financials for this Owner
Home Financials are based on the most recent Mortgage that was taken out on this home.
Original Mortgage
$390,000
Interest Rate
6.5%
Mortgage Type
New Conventional
Purchase Details
Closed on
Oct 6, 2004
Sold by
Loorz Tom
Bought by
Loorz Thomas P and Thomas P Loorz Trust
Create a Home Valuation Report for This Property
The Home Valuation Report is an in-depth analysis detailing your home's value as well as a comparison with similar homes in the area
Home Values in the Area
Average Home Value in this Area
Purchase History
| Date | Buyer | Sale Price | Title Company |
|---|---|---|---|
| Thomas P Loorz Trust | -- | Old Republic Title Company | |
| Loorz Thomas P | -- | Old Republic Title Company | |
| Thomas P Loorz Trust | -- | Old Republic Title Company | |
| Loorz Thomas P | -- | Old Republic Title Company | |
| Loorz Thomas P | -- | Accommodation | |
| Loorz Thomas P | -- | Stewart Title Of Ca Inc | |
| Loorz Thomas P | -- | -- |
Source: Public Records
Mortgage History
| Date | Status | Borrower | Loan Amount |
|---|---|---|---|
| Open | Loorz Thomas P | $100,000 | |
| Previous Owner | Loorz Thomas P | $30,000 | |
| Previous Owner | Loorz Thomas P | $390,000 |
Source: Public Records
Tax History
| Year | Tax Paid | Tax Assessment Tax Assessment Total Assessment is a certain percentage of the fair market value that is determined by local assessors to be the total taxable value of land and additions on the property. | Land | Improvement |
|---|---|---|---|---|
| 2025 | $2,430 | $234,028 | $104,010 | $130,018 |
| 2024 | $2,430 | $229,440 | $101,971 | $127,469 |
| 2023 | $2,443 | $224,942 | $99,972 | $124,970 |
| 2022 | $2,408 | $220,532 | $98,012 | $122,520 |
| 2021 | $2,372 | $216,209 | $96,091 | $120,118 |
| 2020 | $2,283 | $213,993 | $95,106 | $118,887 |
| 2019 | $2,389 | $209,798 | $93,242 | $116,556 |
| 2018 | $2,295 | $205,685 | $91,414 | $114,271 |
| 2017 | $2,128 | $201,653 | $89,622 | $112,031 |
| 2016 | $2,089 | $197,700 | $87,865 | $109,835 |
| 2015 | $2,058 | $194,732 | $86,546 | $108,186 |
| 2014 | $2,023 | $190,918 | $84,851 | $106,067 |
Source: Public Records
Map
Nearby Homes
- 1986 Luxton St
- 1355 La Salle Ave
- 2080 Buchanan St
- 1809 Vallejo St
- 1206 La Salle Ave Unit 7
- 1740 Judson St
- 1714 Luxton St
- 4460 Ocean Heights Ct
- 1688 Harding St
- 1790 Fernando St
- 1659 Judson St
- 1666 Hilton St
- 1146 Birch Ave Unit 19
- 1732 Fernando St
- 0 Tioga Ave Unit ML82030096
- 4386 Parker Flats
- 1610 Soto St
- 1125 Olympia Ave
- 1580 Ancon St
- 1330 Flores St
- 2085 Cross St
- 2045 Cross St
- 2060 Waring St
- 2076 Waring St
- 2040 Waring St
- 2080 Cross St
- 2086 Waring St
- 2026 Waring St
- 2035 Cross St
- 1438 Military Ave
- 2090 Cross St
- 2040 Cross St
- 2090 Waring St
- 2020 Waring St
- 1465 Alta Vista Ct
- 2045 Waring St
- 2025 Cross St
- 2096 Waring St
- 1476 Military Ave
- 2030 Cross St
Your Personal Tour Guide
Ask me questions while you tour the home.