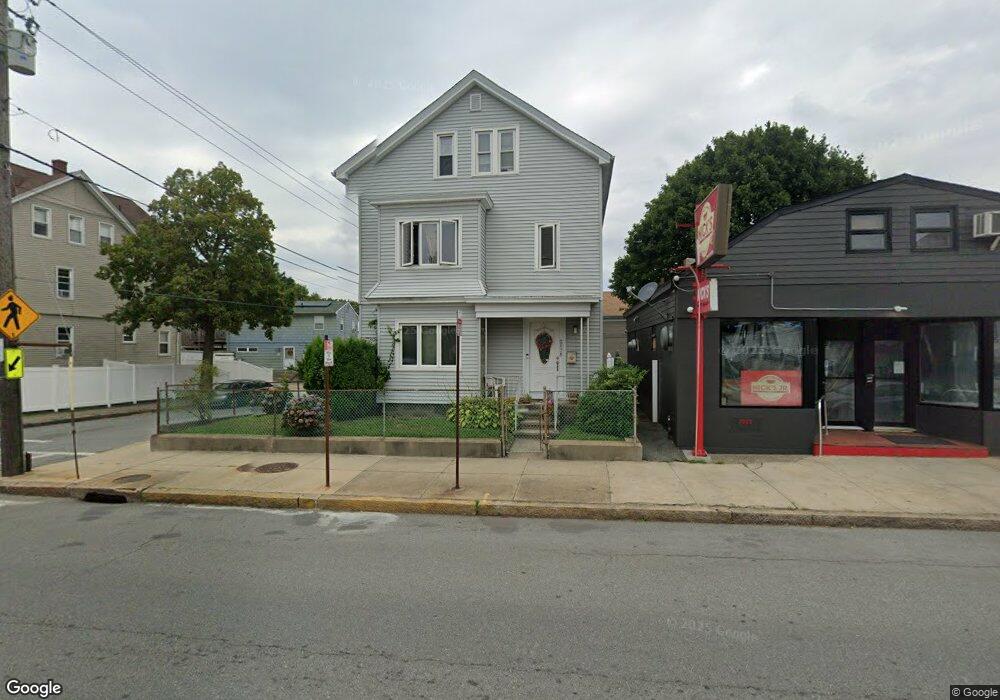
2075 S Main St Fall River, MA 02724
Sandy Beach NeighborhoodEstimated Value: $439,379 - $599,000
5
Beds
3
Baths
2,581
Sq Ft
$205/Sq Ft
Est. Value
About This Home
This home is located at 2075 S Main St, Fall River, MA 02724 and is currently estimated at $529,845, approximately $205 per square foot. 2075 S Main St is a home located in Bristol County with nearby schools including Carlton M. Viveiros Elementary School, Matthew J. Kuss Middle School, and B M C Durfee High School.
Ownership History
Date
Name
Owned For
Owner Type
Purchase Details
Closed on
May 1, 2000
Sold by
Kidd Diane M
Bought by
Snizek Jeffrey T and Snizek Lucy M
Current Estimated Value
Home Financials for this Owner
Home Financials are based on the most recent Mortgage that was taken out on this home.
Original Mortgage
$90,000
Outstanding Balance
$31,294
Interest Rate
8.23%
Mortgage Type
Purchase Money Mortgage
Estimated Equity
$498,551
Create a Home Valuation Report for This Property
The Home Valuation Report is an in-depth analysis detailing your home's value as well as a comparison with similar homes in the area
Home Values in the Area
Average Home Value in this Area
Purchase History
| Date | Buyer | Sale Price | Title Company |
|---|---|---|---|
| Snizek Jeffrey T | $137,000 | -- |
Source: Public Records
Mortgage History
| Date | Status | Borrower | Loan Amount |
|---|---|---|---|
| Open | Snizek Jeffrey T | $20,400 | |
| Open | Snizek Jeffrey T | $90,000 |
Source: Public Records
Tax History
| Year | Tax Paid | Tax Assessment Tax Assessment Total Assessment is a certain percentage of the fair market value that is determined by local assessors to be the total taxable value of land and additions on the property. | Land | Improvement |
|---|---|---|---|---|
| 2025 | $4,685 | $409,200 | $106,400 | $302,800 |
| 2024 | $4,275 | $372,100 | $102,400 | $269,700 |
| 2023 | $3,877 | $316,000 | $84,600 | $231,400 |
| 2022 | $3,590 | $284,500 | $80,600 | $203,900 |
| 2021 | $3,513 | $239,900 | $76,700 | $163,200 |
| 2020 | $3,526 | $206,200 | $75,600 | $130,600 |
| 2019 | $2,821 | $193,500 | $72,800 | $120,700 |
| 2018 | $3,602 | $184,900 | $78,800 | $106,100 |
| 2017 | $2,454 | $175,300 | $75,100 | $100,200 |
| 2016 | $2,421 | $177,600 | $79,900 | $97,700 |
| 2015 | $2,324 | $177,700 | $79,900 | $97,800 |
| 2014 | $2,366 | $188,100 | $77,600 | $110,500 |
Source: Public Records
Map
Nearby Homes
- 616 Woodman St
- 126 Wheeler St
- 2229 S Main St
- 15 Higgins St
- 57 Larouche St
- 609 King Philip St
- 1852 S Main St
- 1846 S Main St
- 464 Birch St
- 30 Broad St
- 579 Summit St Unit 3
- 579 Summit St Unit 2
- 245 Dwelly St
- 234 Kilburn St
- 917 Dwelly St
- 24 Valley St
- 391 Clarkson St
- 20 Wilcox St
- 42 Main Rd
- 1334 S Main St
- 2067 S Main St
- 2069 S Main St
- 2055 S Main St
- 2093 S Main St Unit 2095
- 378 Walter St
- 369 Walter St
- 2107 S Main St
- 58 Lester St
- 2070 S Main St
- 2064 S Main St
- 355 Walter St
- 44 Lester St
- 340 Walter St
- 2036 S Main St
- 2036 S Main St Unit 2South
- 333 Walter St
- 31 Howe St
- 30 Lester St
- 0 Kay St
- 0 Kay St Unit 71427311
Your Personal Tour Guide
Ask me questions while you tour the home.