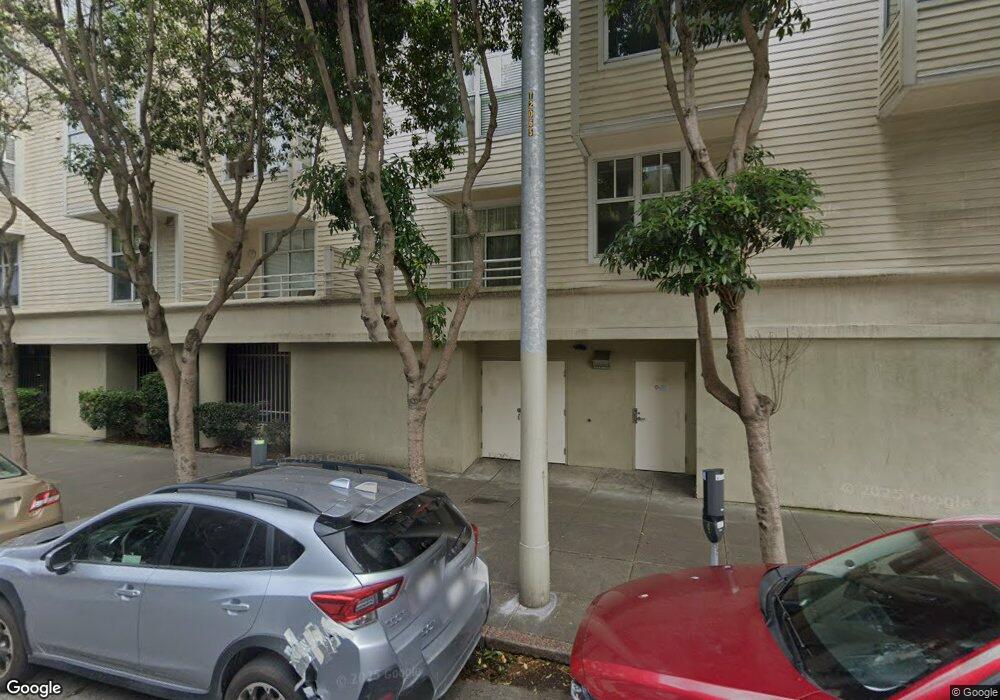
2075 Sutter St Unit 231 San Francisco, CA 94115
Lower Pacific Heights NeighborhoodEstimated Value: $1,112,000 - $1,232,000
2
Beds
2
Baths
1,120
Sq Ft
$1,038/Sq Ft
Est. Value
About This Home
This home is located at 2075 Sutter St Unit 231, San Francisco, CA 94115 and is currently estimated at $1,162,547, approximately $1,037 per square foot. 2075 Sutter St Unit 231 is a home located in San Francisco County with nearby schools including Sherman Elementary, Marina Middle School, and KIPP San Francisco Bay Academy.
Ownership History
Date
Name
Owned For
Owner Type
Purchase Details
Closed on
Jul 22, 2022
Sold by
Rosabel S Tao Family Trust and Tao Rosabel S
Bought by
Rosabel S Tao Separate Property Trust and Kilpatrick Tao Family Trust
Current Estimated Value
Purchase Details
Closed on
Jun 27, 2012
Sold by
Tao Rosabel and Tao Rosabel S
Bought by
Tao Rosabel S and The Rosabel S Tao Family Trust
Home Financials for this Owner
Home Financials are based on the most recent Mortgage that was taken out on this home.
Original Mortgage
$625,500
Interest Rate
3.74%
Mortgage Type
New Conventional
Purchase Details
Closed on
Jul 28, 1998
Sold by
Hsu Ching Fei and Ching Ling
Bought by
Cristiani Laura F
Home Financials for this Owner
Home Financials are based on the most recent Mortgage that was taken out on this home.
Original Mortgage
$388,000
Interest Rate
6.9%
Create a Home Valuation Report for This Property
The Home Valuation Report is an in-depth analysis detailing your home's value as well as a comparison with similar homes in the area
Home Values in the Area
Average Home Value in this Area
Purchase History
| Date | Buyer | Sale Price | Title Company |
|---|---|---|---|
| Rosabel S Tao Separate Property Trust | -- | None Listed On Document | |
| Tao Rosabel S | -- | Chicago Title Company | |
| Tao Rosabel | $841,000 | Chicago Title Company | |
| Cristiani Laura F | $388,000 | Fidelity National Title Co |
Source: Public Records
Mortgage History
| Date | Status | Borrower | Loan Amount |
|---|---|---|---|
| Previous Owner | Tao Rosabel | $625,500 | |
| Previous Owner | Cristiani Laura F | $388,000 |
Source: Public Records
Tax History Compared to Growth
Tax History
| Year | Tax Paid | Tax Assessment Tax Assessment Total Assessment is a certain percentage of the fair market value that is determined by local assessors to be the total taxable value of land and additions on the property. | Land | Improvement |
|---|---|---|---|---|
| 2025 | $12,630 | $1,035,620 | $517,810 | $517,810 |
| 2024 | $12,630 | $1,015,314 | $507,657 | $507,657 |
| 2023 | $12,423 | $995,406 | $497,703 | $497,703 |
| 2022 | $12,177 | $975,890 | $487,945 | $487,945 |
| 2021 | $11,959 | $956,756 | $478,378 | $478,378 |
| 2020 | $12,019 | $946,946 | $473,473 | $473,473 |
| 2019 | $11,608 | $928,380 | $464,190 | $464,190 |
| 2018 | $11,217 | $910,178 | $455,089 | $455,089 |
| 2017 | $10,785 | $892,332 | $446,166 | $446,166 |
| 2016 | $10,600 | $874,836 | $437,418 | $437,418 |
| 2015 | $10,467 | $861,696 | $430,848 | $430,848 |
| 2014 | $10,191 | $844,818 | $422,409 | $422,409 |
Source: Public Records
Map
Nearby Homes
- 2075 Sutter St Unit 215
- 2232 Bush St
- 1715 Webster St
- 2850 2854 Jackson St
- 2332 2334 California St
- 132 136 Presidio Ave
- 2536 California St
- 1939 Ofarrell St
- 1530 Ofarrell St Unit 1
- 1400 Webster St Unit 6
- 1520 Ofarrell St Unit 4
- 1540 Ofarrell St Unit 1
- 2112 Pine St Unit B
- 1519 Ofarrell St
- 2215 California St
- 2020 Webster St
- 1365 Scott St Unit 1
- 1942 Bush St
- 75 Western Shore Ln Unit 1
- 2051 Scott St Unit 101
- 2075 Sutter St Unit 207
- 2075 Sutter St Unit 513
- 2075 Sutter St Unit 511
- 2075 Sutter St Unit 509
- 2075 Sutter St Unit 507
- 2075 Sutter St Unit 505
- 2075 Sutter St Unit 503
- 2075 Sutter St Unit 501
- 2075 Sutter St Unit 319
- 2075 Sutter St Unit 317
- 2075 Sutter St Unit 235
- 2075 Sutter St Unit 233
- 2075 Sutter St Unit 229
- 2075 Sutter St Unit 227
- 2075 Sutter St Unit 223
- 2075 Sutter St Unit 221
- 2075 Sutter St Unit 219
- 2075 Sutter St Unit 213
- 2075 Sutter St Unit 211
- 2075 Sutter St Unit 209