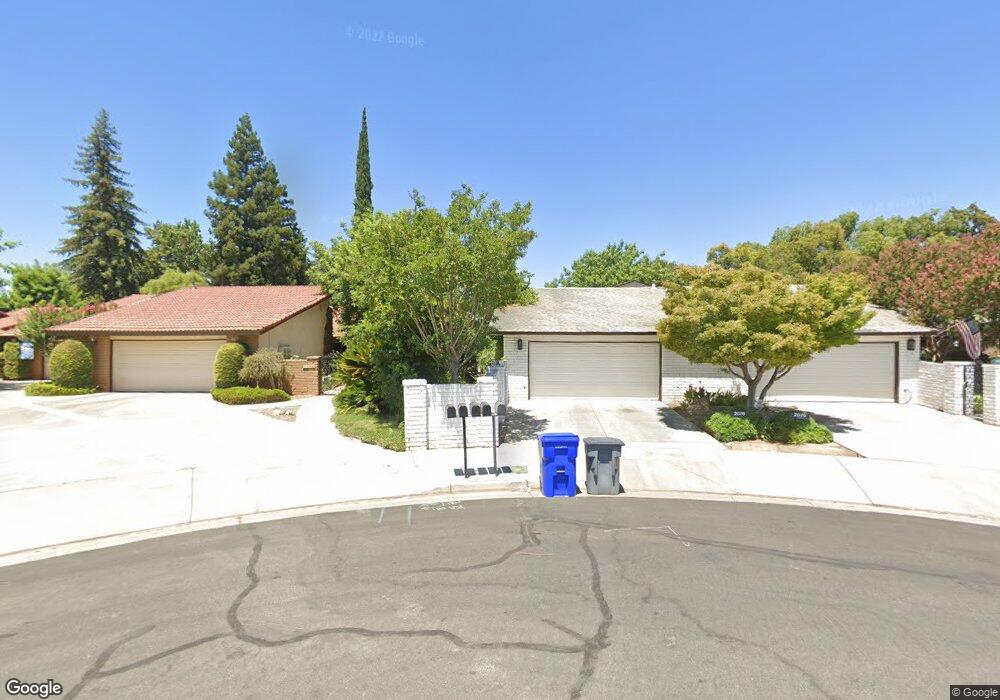
2076 W Calimyrna Ave Unit 101 Fresno, CA 93711
Van Ness Extension NeighborhoodEstimated Value: $327,225 - $344,000
2
Beds
2
Baths
1,596
Sq Ft
$210/Sq Ft
Est. Value
About This Home
This home is located at 2076 W Calimyrna Ave Unit 101, Fresno, CA 93711 and is currently estimated at $335,556, approximately $210 per square foot. 2076 W Calimyrna Ave Unit 101 is a home located in Fresno County with nearby schools including Starr Elementary School, Tenaya Middle School, and Bullard High School.
Ownership History
Date
Name
Owned For
Owner Type
Purchase Details
Closed on
Oct 10, 2008
Sold by
Tolladay Joy C
Bought by
Noble Alan Randolph and Noble Lisa Hewitt
Current Estimated Value
Purchase Details
Closed on
Jun 27, 2006
Sold by
Tolladay Joy C
Bought by
Tolladay Joy C
Purchase Details
Closed on
Oct 6, 2005
Sold by
Bressler V Laureen
Bought by
Bressler V Laureen and V Laureen Bressler Revocable Living Tr
Purchase Details
Closed on
May 4, 2001
Sold by
Ryals Raymond Lee and Ryals Haroldean Janet
Bought by
Bressler V Laureen
Home Financials for this Owner
Home Financials are based on the most recent Mortgage that was taken out on this home.
Original Mortgage
$98,360
Interest Rate
6.03%
Create a Home Valuation Report for This Property
The Home Valuation Report is an in-depth analysis detailing your home's value as well as a comparison with similar homes in the area
Home Values in the Area
Average Home Value in this Area
Purchase History
| Date | Buyer | Sale Price | Title Company |
|---|---|---|---|
| Noble Alan Randolph | $200,000 | Placer Title Company | |
| Tolladay Joy C | -- | Placer Title Company | |
| Tolladay Joy C | -- | None Available | |
| Bressler V Laureen | -- | -- | |
| Bressler V Laureen | $123,000 | Fidelity National Title Co |
Source: Public Records
Mortgage History
| Date | Status | Borrower | Loan Amount |
|---|---|---|---|
| Previous Owner | Bressler V Laureen | $98,360 |
Source: Public Records
Tax History Compared to Growth
Tax History
| Year | Tax Paid | Tax Assessment Tax Assessment Total Assessment is a certain percentage of the fair market value that is determined by local assessors to be the total taxable value of land and additions on the property. | Land | Improvement |
|---|---|---|---|---|
| 2025 | $3,351 | $257,535 | $64,379 | $193,156 |
| 2023 | $3,162 | $247,536 | $61,880 | $185,656 |
| 2022 | $3,119 | $242,683 | $60,667 | $182,016 |
| 2021 | $3,033 | $237,926 | $59,478 | $178,448 |
| 2020 | $2,950 | $230,000 | $58,000 | $172,000 |
| 2019 | $2,706 | $215,000 | $53,000 | $162,000 |
| 2018 | $2,700 | $215,000 | $53,000 | $162,000 |
| 2017 | $2,394 | $190,000 | $47,000 | $143,000 |
| 2016 | $2,115 | $170,000 | $42,000 | $128,000 |
| 2015 | $1,991 | $160,000 | $40,000 | $120,000 |
| 2014 | $1,992 | $160,000 | $40,000 | $120,000 |
Source: Public Records
Map
Nearby Homes
- 2073 W Calimyrna Ave Unit 101
- 2140 W Rue st Michel
- 2157 W Rue st Michel
- 1709 W Calimyrna Ave Unit 9A
- 5811 N Forkner Ave
- 5740 N West Ave Unit 109
- 5649 N Romeo Ln
- 2058 W Vartikian Ave
- 6060 N Van Ness Blvd
- 6067 N Teilman Ave
- 1545 W Calimyrna Ave
- 5554 N El Adobe Dr
- 1486 W Roberts Ave
- 1647 W Wrenwood Ave
- 6518 N Dolores Ave
- 6490 N Sequoia Dr
- 1720 W Barstow Ave
- 5627 N Kavanagh Ave
- 1646 W Paul Ave
- 2234 W San Madele Ave
- 2058 W Calimyrna Ave Unit 102
- 2058 W Calimyrna Ave
- 2058 W Calimyrna Ave
- 2050 W Calimyrna Ave
- 2050 W Calimyrna Ave Unit 11A
- 2078 W Calimyrna Ave Unit 8C
- 2078 W Calimyrna Ave
- 2078 W Calimyrna Ave
- 2078 W Calimyrna Ave
- 2038 W Calimyrna Ave Unit 101
- 2038 W Calimyrna Ave
- 2073 W Calimyrna Ave
- 2073 W Calimyrna Ave Unit 102
- 2073 W Calimyrna Ave Unit 6B
- 2059 W Calimyrna Ave Unit 101
- 2059 W Calimyrna Ave
- 2059 W Calimyrna Ave
- 2079 W Calimyrna Ave Unit 102
- 2079 W Calimyrna Ave Unit 101
- 2079 W Calimyrna Ave Unit 103