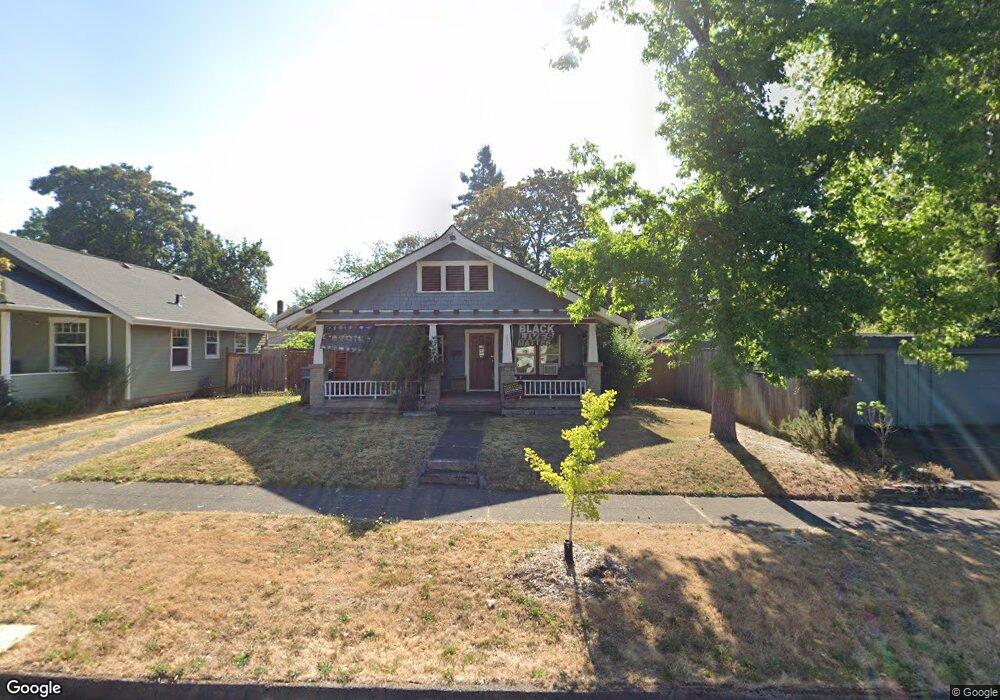
2077 Onyx St Eugene, OR 97403
South University NeighborhoodEstimated Value: $486,375 - $677,000
2
Beds
1
Bath
1,225
Sq Ft
$466/Sq Ft
Est. Value
About This Home
This home is located at 2077 Onyx St, Eugene, OR 97403 and is currently estimated at $571,094, approximately $466 per square foot. 2077 Onyx St is a home located in Lane County with nearby schools including Edison Elementary School, Roosevelt Middle School, and South Eugene High School.
Ownership History
Date
Name
Owned For
Owner Type
Purchase Details
Closed on
Jun 18, 2015
Sold by
Holsman Ronald H and Holsman Linda
Bought by
The Holsman Family Holdings Llc
Current Estimated Value
Purchase Details
Closed on
Oct 18, 2005
Sold by
Johnson Mark L and Johnson Sandra Mcmorris
Bought by
Holsman Ronald H and Holsman Linda
Home Financials for this Owner
Home Financials are based on the most recent Mortgage that was taken out on this home.
Original Mortgage
$242,900
Outstanding Balance
$183,564
Interest Rate
5.66%
Mortgage Type
Purchase Money Mortgage
Estimated Equity
$387,530
Purchase Details
Closed on
Jun 15, 2004
Sold by
Haring Jack L and Haring Linda A
Bought by
Johnson Mark L and Johnson Sandra Mcmorris
Home Financials for this Owner
Home Financials are based on the most recent Mortgage that was taken out on this home.
Original Mortgage
$150,000
Interest Rate
6.09%
Mortgage Type
Unknown
Create a Home Valuation Report for This Property
The Home Valuation Report is an in-depth analysis detailing your home's value as well as a comparison with similar homes in the area
Home Values in the Area
Average Home Value in this Area
Purchase History
| Date | Buyer | Sale Price | Title Company |
|---|---|---|---|
| The Holsman Family Holdings Llc | -- | None Available | |
| Holsman Ronald H | $347,000 | Cascade Title Co | |
| Johnson Mark L | $187,500 | Western Pioneer Title Co |
Source: Public Records
Mortgage History
| Date | Status | Borrower | Loan Amount |
|---|---|---|---|
| Open | Holsman Ronald H | $242,900 | |
| Previous Owner | Johnson Mark L | $150,000 |
Source: Public Records
Tax History
| Year | Tax Paid | Tax Assessment Tax Assessment Total Assessment is a certain percentage of the fair market value that is determined by local assessors to be the total taxable value of land and additions on the property. | Land | Improvement |
|---|---|---|---|---|
| 2025 | $5,127 | $263,140 | -- | -- |
| 2024 | $5,063 | $255,476 | -- | -- |
| 2023 | $5,063 | $248,035 | $0 | $0 |
| 2022 | $4,743 | $240,811 | $0 | $0 |
| 2021 | $4,455 | $233,798 | $0 | $0 |
| 2020 | $4,471 | $226,989 | $0 | $0 |
| 2019 | $4,318 | $220,378 | $0 | $0 |
| 2018 | $4,064 | $207,728 | $0 | $0 |
| 2017 | $3,882 | $207,728 | $0 | $0 |
| 2016 | $3,786 | $201,678 | $0 | $0 |
| 2015 | $3,677 | $195,804 | $0 | $0 |
| 2014 | $3,603 | $190,101 | $0 | $0 |
Source: Public Records
Map
Nearby Homes
- 2042 Onyx St
- 780 E 22nd Ave
- 2610 Elinor St
- 2642 Central Blvd
- 0 Agate St
- 275 Sunset Dr
- 2646 Cascara Dr
- 2642 Cascara Dr
- 2707 Hilyard St
- 2683 Cresta de Ruta St
- 2993 Capital Dr Unit 1
- 1733 Mill Aly
- 508 E 14th Ave
- 2749 Hilyard St
- 2985 Capital Dr Unit 3
- 2825 2819 Capital Dr Unit 18, 19
- 0 Capital Dr
- 2969 Capital Dr
- 2620 Cupola Dr Unit 27
- 2694 Cupola Dr Unit 21
Your Personal Tour Guide
Ask me questions while you tour the home.