Estimated Value: $363,000 - $449,000
3
Beds
2
Baths
1,950
Sq Ft
$204/Sq Ft
Est. Value
About This Home
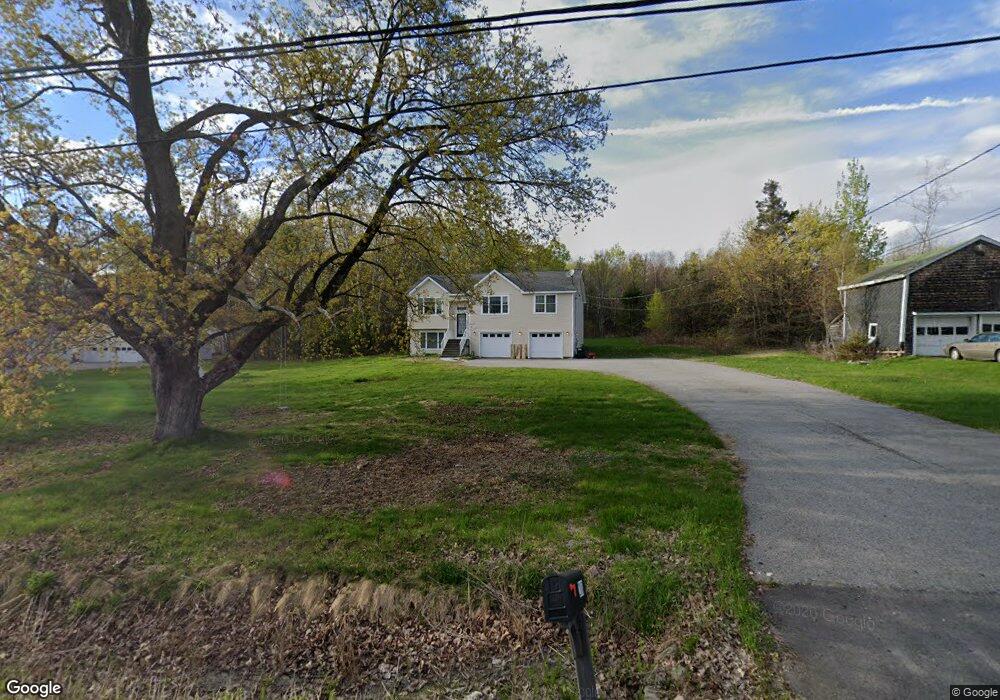
This home is located at 208 Forest Ave, Orono, ME 04473 and is currently estimated at $398,277, approximately $204 per square foot. 208 Forest Ave is a home located in Penobscot County with nearby schools including Orono Middle School and Orono High School.
Ownership History
Date
Name
Owned For
Owner Type
Purchase Details
Closed on
Dec 19, 2019
Sold by
Mcgivney Randall K and Mcgivney Suzanne E
Bought by
Sopo Holdings Llc
Current Estimated Value
Home Financials for this Owner
Home Financials are based on the most recent Mortgage that was taken out on this home.
Original Mortgage
$172,000
Outstanding Balance
$151,643
Interest Rate
3.6%
Mortgage Type
New Conventional
Estimated Equity
$246,634
Purchase Details
Closed on
Jun 15, 2007
Sold by
Brigham R Craig
Bought by
Mcgivney Randall K and Mcgivney Suzanne E
Home Financials for this Owner
Home Financials are based on the most recent Mortgage that was taken out on this home.
Original Mortgage
$197,600
Interest Rate
6.63%
Mortgage Type
Unknown
Create a Home Valuation Report for This Property
The Home Valuation Report is an in-depth analysis detailing your home's value as well as a comparison with similar homes in the area
Home Values in the Area
Average Home Value in this Area
Purchase History
| Date | Buyer | Sale Price | Title Company |
|---|---|---|---|
| Sopo Holdings Llc | -- | None Available | |
| Mcgivney Randall K | -- | -- |
Source: Public Records
Mortgage History
| Date | Status | Borrower | Loan Amount |
|---|---|---|---|
| Open | Sopo Holdings Llc | $172,000 | |
| Previous Owner | Mcgivney Randall K | $197,600 |
Source: Public Records
Tax History Compared to Growth
Tax History
| Year | Tax Paid | Tax Assessment Tax Assessment Total Assessment is a certain percentage of the fair market value that is determined by local assessors to be the total taxable value of land and additions on the property. | Land | Improvement |
|---|---|---|---|---|
| 2024 | $5,549 | $259,900 | $51,800 | $208,100 |
| 2023 | $5,529 | $236,300 | $47,100 | $189,200 |
| 2022 | $5,624 | $236,300 | $47,100 | $189,200 |
| 2021 | $5,612 | $236,300 | $47,100 | $189,200 |
| 2020 | $5,427 | $193,200 | $40,300 | $152,900 |
| 2019 | $5,110 | $193,200 | $40,300 | $152,900 |
| 2018 | $5,216 | $193,200 | $40,300 | $152,900 |
| 2017 | $5,023 | $193,200 | $40,300 | $152,900 |
| 2016 | $4,801 | $193,200 | $40,300 | $152,900 |
| 2015 | $4,714 | $193,200 | $40,300 | $152,900 |
| 2014 | $4,608 | $193,200 | $40,300 | $152,900 |
| 2013 | $4,482 | $193,200 | $40,300 | $152,900 |
Source: Public Records
Map
Nearby Homes
- Lot 14 Grant Rd
- Lot 12 Grant Rd
- 82 Grant Rd
- 0 Kelley Rd
- 8 Sylvan Rd
- 22 Westwood Dr
- 148 College Ave
- 41 Kelley Rd
- 0 Kirkland Rd
- 2 Chapel Rd
- 7 Forest Ave
- 715 College Ave Unit 24
- 715 College Ave Unit 51
- 270 Stillwater Ave
- 1024 Stillwater Ave
- 50 College Ave
- 12 Island Ave
- 25 Margin St
- 5 Summer St
- 292 Main St