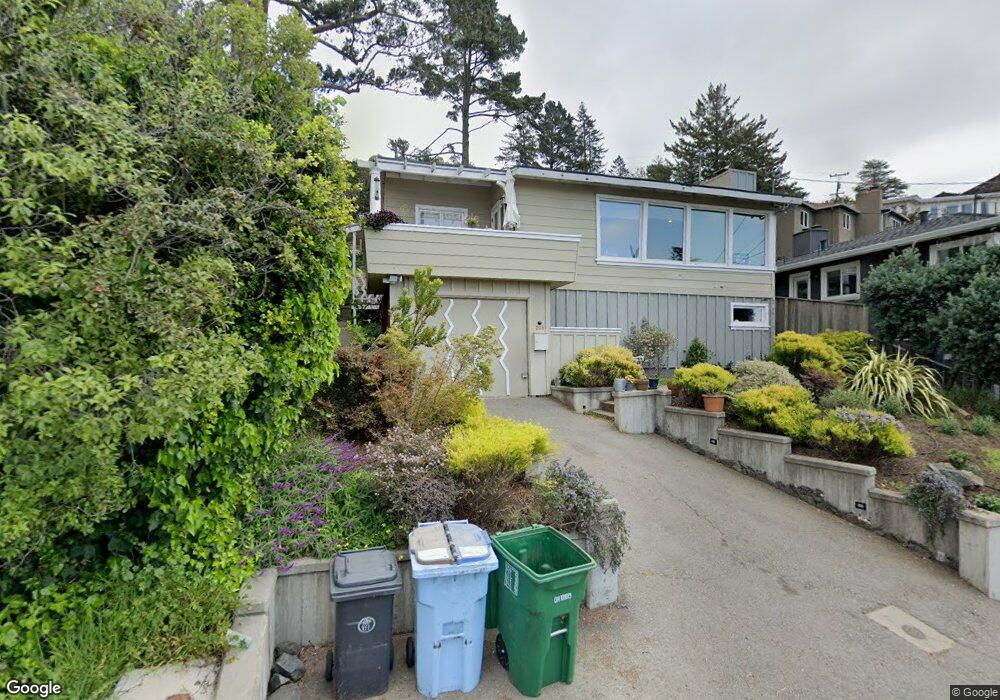
208 Forest Ln Berkeley, CA 94708
Berkeley Hills NeighborhoodEstimated Value: $1,380,000 - $1,544,000
3
Beds
2
Baths
1,736
Sq Ft
$853/Sq Ft
Est. Value
About This Home
This home is located at 208 Forest Ln, Berkeley, CA 94708 and is currently estimated at $1,480,469, approximately $852 per square foot. 208 Forest Ln is a home located in Alameda County with nearby schools including Cragmont Elementary School, Berkeley Arts Magnet at Whittier School, and Washington Elementary School.
Ownership History
Date
Name
Owned For
Owner Type
Purchase Details
Closed on
Mar 20, 2018
Sold by
Farrell Paul A and Farrell Colleen K
Bought by
Farrell Paul and Farrell Colleen
Current Estimated Value
Purchase Details
Closed on
Dec 9, 1993
Sold by
Farrell William E
Bought by
Farrell Paul A
Home Financials for this Owner
Home Financials are based on the most recent Mortgage that was taken out on this home.
Original Mortgage
$180,000
Interest Rate
7.09%
Create a Home Valuation Report for This Property
The Home Valuation Report is an in-depth analysis detailing your home's value as well as a comparison with similar homes in the area
Home Values in the Area
Average Home Value in this Area
Purchase History
| Date | Buyer | Sale Price | Title Company |
|---|---|---|---|
| Farrell Paul | -- | None Available | |
| Farrell Paul A | $72,000 | Old Republic Title Company |
Source: Public Records
Mortgage History
| Date | Status | Borrower | Loan Amount |
|---|---|---|---|
| Previous Owner | Farrell Paul A | $180,000 |
Source: Public Records
Tax History
| Year | Tax Paid | Tax Assessment Tax Assessment Total Assessment is a certain percentage of the fair market value that is determined by local assessors to be the total taxable value of land and additions on the property. | Land | Improvement |
|---|---|---|---|---|
| 2025 | $10,010 | $525,211 | $132,568 | $399,643 |
| 2024 | $10,010 | $514,778 | $129,969 | $391,809 |
| 2023 | $9,727 | $511,548 | $127,421 | $384,127 |
| 2022 | $9,459 | $494,519 | $124,923 | $376,596 |
| 2021 | $9,457 | $484,686 | $122,474 | $369,212 |
| 2020 | $8,914 | $486,645 | $121,218 | $365,427 |
| 2019 | $8,512 | $477,103 | $118,841 | $358,262 |
| 2018 | $8,338 | $467,750 | $116,511 | $351,239 |
| 2017 | $8,031 | $458,581 | $114,227 | $344,354 |
| 2016 | $7,721 | $449,592 | $111,988 | $337,604 |
| 2015 | $7,602 | $442,840 | $110,306 | $332,534 |
| 2014 | $7,470 | $434,167 | $108,146 | $326,021 |
Source: Public Records
Map
Nearby Homes
- 935 Grizzly Peak Blvd
- 730 Wildcat Canyon Rd
- 1024 Grizzly Peak Blvd
- 1085 Creston Rd
- 962 Regal Rd
- 777 Cragmont Ave
- 606 Grizzly Peak Blvd
- 1106 Cragmont Ave
- 1110 Sterling Ave
- 758 Spruce St
- 1004 Cragmont Ave
- 1160 Miller Ave
- 1155 Keeler Ave
- 543 Grizzly Peak Blvd
- 614 Cragmont Ave
- 1165 Cragmont Ave
- 938 San Benito Rd
- 813 San Diego Rd
- 765 San Diego Rd
- 1221 Grizzly Peak Blvd
- 936 Creston Rd
- 204 Forest Ln
- 950 Creston Rd
- 930 Creston Rd
- 200 Forest Ln
- 931 Grizzly Peak Blvd
- 937 Creston Rd
- 941 Creston Rd
- 933 Creston Rd
- 945 Creston Rd
- 925 Grizzly Peak Blvd
- 956 Creston Rd
- 927 Creston Rd
- 923 Creston Rd
- 955 Creston Rd
- 263 Forest Ln
- 921 Grizzly Peak Blvd
- 930 Grizzly Peak Blvd
- 919 Creston Rd
- 966 Creston Rd
Your Personal Tour Guide
Ask me questions while you tour the home.