Estimated Value: $186,000 - $216,000
2
Beds
2
Baths
864
Sq Ft
$227/Sq Ft
Est. Value
About This Home
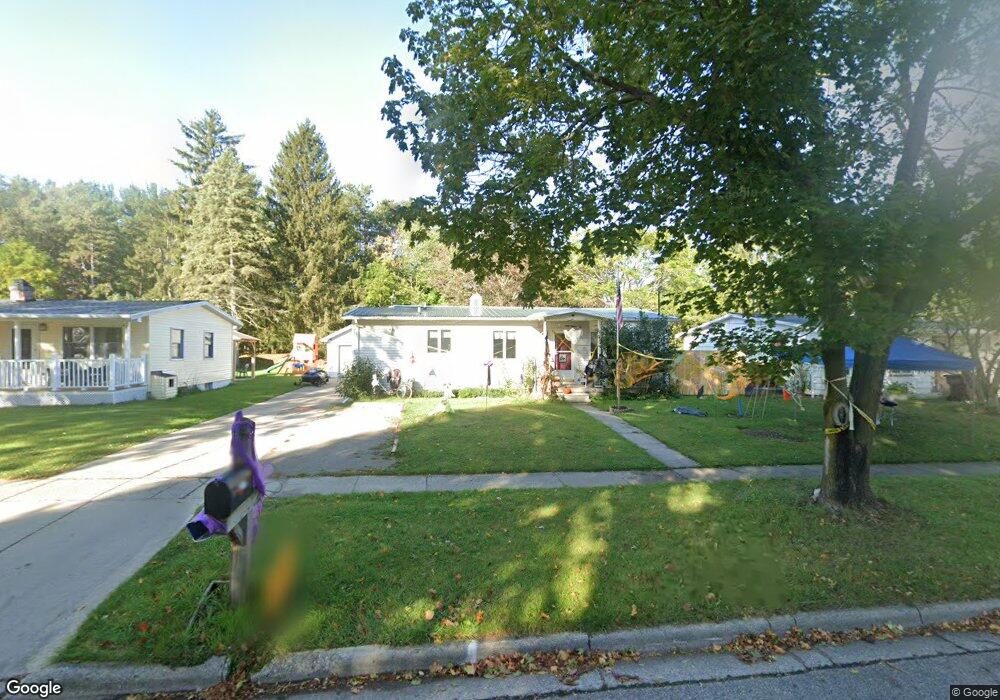
This home is located at 208 Katheryn St, Mason, MI 48854 and is currently estimated at $196,000, approximately $226 per square foot. 208 Katheryn St is a home located in Ingham County with nearby schools including Mason High School.
Ownership History
Date
Name
Owned For
Owner Type
Purchase Details
Closed on
Jul 31, 2020
Sold by
Sweezy Ben and Sweezy Jodi
Bought by
Sweezy Alexis Mae and Schunk Benjamin Riley
Current Estimated Value
Home Financials for this Owner
Home Financials are based on the most recent Mortgage that was taken out on this home.
Original Mortgage
$100,000
Outstanding Balance
$88,871
Interest Rate
3.1%
Mortgage Type
New Conventional
Estimated Equity
$107,129
Purchase Details
Closed on
Aug 21, 2019
Sold by
Sweezy Jodi and Henneman William R
Bought by
Sweezy Jodi and Sweezy Ben
Home Financials for this Owner
Home Financials are based on the most recent Mortgage that was taken out on this home.
Original Mortgage
$97,400
Interest Rate
3.4%
Mortgage Type
New Conventional
Purchase Details
Closed on
Aug 22, 2017
Sold by
Henneman Richard J and Henneman Mary L
Bought by
Henneman Richard J and Henneman Mary
Create a Home Valuation Report for This Property
The Home Valuation Report is an in-depth analysis detailing your home's value as well as a comparison with similar homes in the area
Home Values in the Area
Average Home Value in this Area
Purchase History
| Date | Buyer | Sale Price | Title Company |
|---|---|---|---|
| Sweezy Alexis Mae | -- | Liberty Title | |
| Sweezy Jodi | -- | Timios Inc | |
| Henneman Richard J | -- | None Available |
Source: Public Records
Mortgage History
| Date | Status | Borrower | Loan Amount |
|---|---|---|---|
| Open | Sweezy Alexis Mae | $100,000 | |
| Closed | Sweezy Jodi | $97,400 |
Source: Public Records
Tax History
| Year | Tax Paid | Tax Assessment Tax Assessment Total Assessment is a certain percentage of the fair market value that is determined by local assessors to be the total taxable value of land and additions on the property. | Land | Improvement |
|---|---|---|---|---|
| 2025 | $3,323 | $87,610 | $34,380 | $53,230 |
| 2024 | $24 | $83,720 | $34,380 | $49,340 |
| 2023 | $3,126 | $74,020 | $32,660 | $41,360 |
| 2022 | $2,969 | $63,330 | $16,900 | $46,430 |
| 2021 | $2,850 | $59,950 | $16,900 | $43,050 |
| 2020 | $2,800 | $51,210 | $16,900 | $34,310 |
| 2019 | $2,687 | $48,610 | $7,440 | $41,170 |
| 2018 | $2,654 | $53,880 | $14,530 | $39,350 |
| 2017 | $2,256 | $53,880 | $14,530 | $39,350 |
| 2016 | -- | $49,720 | $10,140 | $39,580 |
| 2015 | -- | $47,270 | $20,277 | $26,993 |
| 2014 | -- | $48,750 | $25,347 | $23,403 |
Source: Public Records
Map
Nearby Homes
- 902 Eagles Nest Ct
- 501 Middlebury Ln
- 323 Oak Ridge St
- 514 W Maple St
- 248 Maple Run
- 1470 N Cedar St
- 607 Carom Cir
- 311 Carom Cir Unit 59
- 106 Carom Cir
- 105 Carom Cir
- 833 S Barnes St
- 334 E Elm St
- 404 E Cherry St
- 422 Ann St
- 300 S College Rd
- 32 Aviemore Dr Unit 32
- 990 Windjammer Ct
- 614 Ann St Unit 25
- 331 N College Rd
- 537 Vanderveen Dr
Your Personal Tour Guide
Ask me questions while you tour the home.