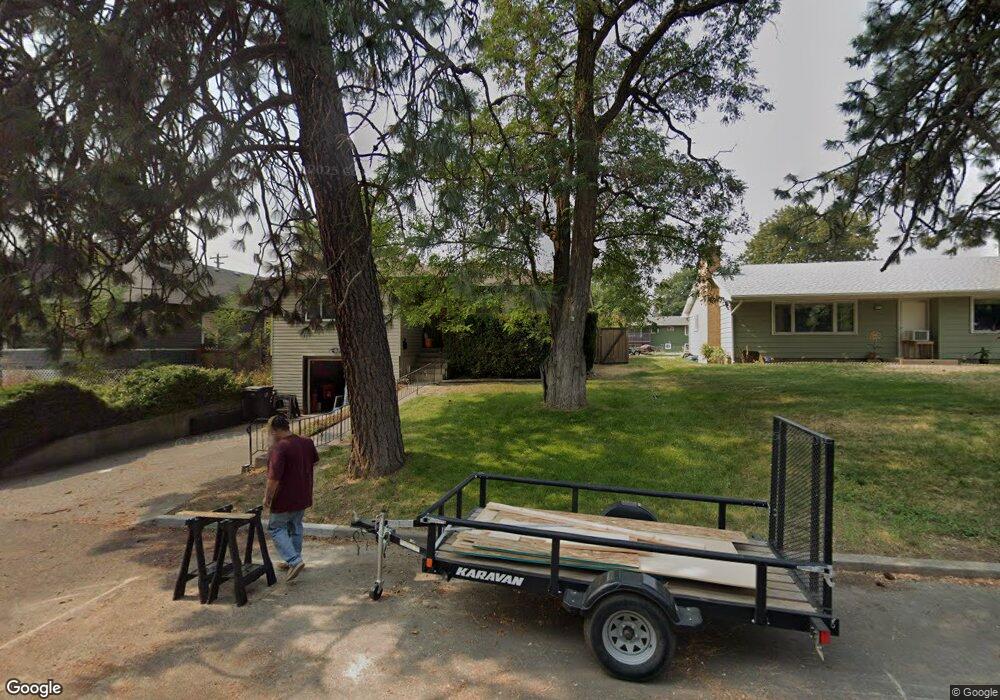
208 N 5th St Cheney, WA 99004
Estimated Value: $322,000 - $339,000
4
Beds
3
Baths
1,820
Sq Ft
$183/Sq Ft
Est. Value
About This Home
This home is located at 208 N 5th St, Cheney, WA 99004 and is currently estimated at $332,488, approximately $182 per square foot. 208 N 5th St is a home located in Spokane County with nearby schools including Betz Elementary School, Cheney Middle School, and Cheney High School.
Ownership History
Date
Name
Owned For
Owner Type
Purchase Details
Closed on
Mar 27, 2007
Sold by
Fuqua William and Fuqua Leslie
Bought by
Fuqua William and Fuqua Leslie
Current Estimated Value
Home Financials for this Owner
Home Financials are based on the most recent Mortgage that was taken out on this home.
Original Mortgage
$57,500
Interest Rate
6.14%
Mortgage Type
Stand Alone Second
Create a Home Valuation Report for This Property
The Home Valuation Report is an in-depth analysis detailing your home's value as well as a comparison with similar homes in the area
Home Values in the Area
Average Home Value in this Area
Purchase History
| Date | Buyer | Sale Price | Title Company |
|---|---|---|---|
| Fuqua William | -- | None Available |
Source: Public Records
Mortgage History
| Date | Status | Borrower | Loan Amount |
|---|---|---|---|
| Closed | Fuqua William | $57,500 |
Source: Public Records
Tax History Compared to Growth
Tax History
| Year | Tax Paid | Tax Assessment Tax Assessment Total Assessment is a certain percentage of the fair market value that is determined by local assessors to be the total taxable value of land and additions on the property. | Land | Improvement |
|---|---|---|---|---|
| 2025 | $3,514 | $292,400 | $70,000 | $222,400 |
| 2024 | $3,514 | $318,700 | $75,000 | $243,700 |
| 2023 | $2,507 | $299,000 | $75,000 | $224,000 |
| 2022 | $2,339 | $299,000 | $75,000 | $224,000 |
| 2021 | $2,146 | $187,400 | $31,500 | $155,900 |
| 2020 | $2,085 | $170,600 | $30,000 | $140,600 |
| 2019 | $1,805 | $155,400 | $28,000 | $127,400 |
| 2018 | $1,983 | $148,700 | $28,000 | $120,700 |
| 2017 | $1,715 | $142,000 | $28,000 | $114,000 |
| 2016 | $1,687 | $134,600 | $28,000 | $106,600 |
| 2015 | $1,568 | $127,200 | $28,000 | $99,200 |
| 2014 | -- | $127,200 | $28,000 | $99,200 |
| 2013 | -- | $0 | $0 | $0 |
Source: Public Records
Map
Nearby Homes
- 306 A St
- 910 2nd St
- 1514 3rd St
- 417 C St
- 1239 1st St
- 1714 4th St
- 311 Peach Tree Ct Unit Lot 4 Block 3 - Orch
- 311 Peach Tree Ct
- 706 2nd St
- 723 2nd St
- 307 Peach Tree Ct
- 307 Peach Tree Ct Unit Lot 5 Block 3 - Clea
- 318 Plum Tree Ct Unit Lot 10 Block 3 - Sno
- 2320 Annie Place Unit Lot 14 Block 2 - Sno
- 2414 Annie Place Unit Lot 10 Block 2 - Cle
- 2331 Annie Place Unit Lot 12 Block 3 - Sno
- 2406 Annie Place Unit Lot 11 Block 2 - Hud
- 317 Peach Tree Ct Unit Lot 3 Block 3 - Orch
- 317 Peach Tree Ct
- 329 Peach Tree Ct Unit Lot 1 Block 3 - Snow