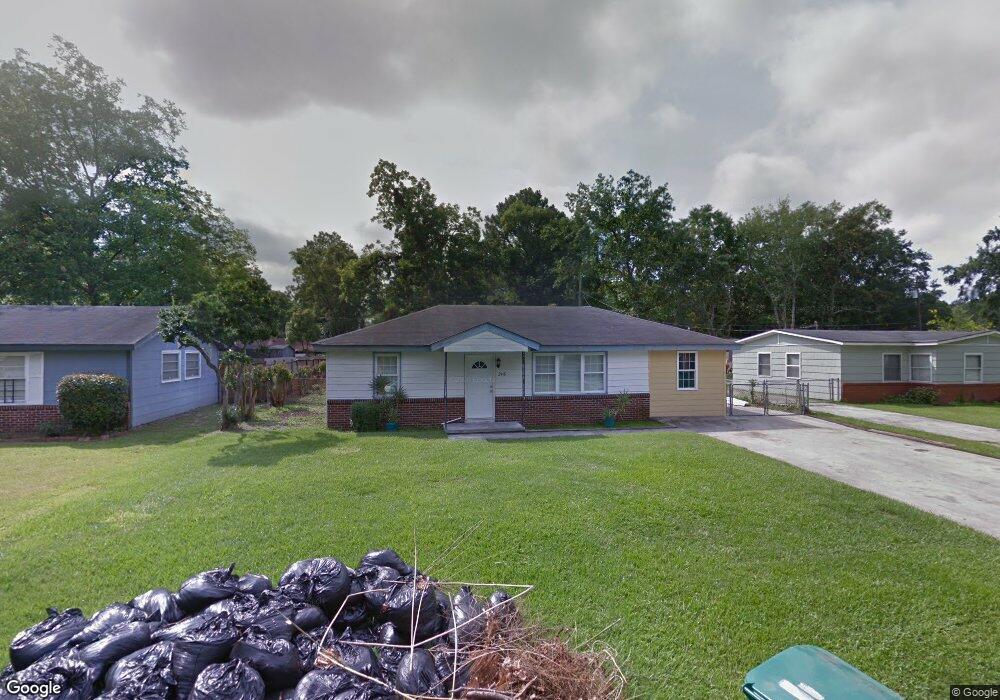
208 Olmstead Place Savannah, GA 31408
Estimated Value: $196,000 - $222,020
3
Beds
1
Bath
1,090
Sq Ft
$192/Sq Ft
Est. Value
About This Home
This home is located at 208 Olmstead Place, Savannah, GA 31408 and is currently estimated at $209,505, approximately $192 per square foot. 208 Olmstead Place is a home located in Chatham County with nearby schools including Garden City Elementary School, Mercer Middle School, and Groves High School.
Ownership History
Date
Name
Owned For
Owner Type
Purchase Details
Closed on
Nov 25, 2019
Sold by
Powell Amos
Bought by
Frazier Bernard
Current Estimated Value
Home Financials for this Owner
Home Financials are based on the most recent Mortgage that was taken out on this home.
Original Mortgage
$108,007
Outstanding Balance
$94,782
Interest Rate
3.75%
Mortgage Type
FHA
Estimated Equity
$114,723
Purchase Details
Closed on
Feb 13, 2012
Bought by
Powell Amos
Purchase Details
Closed on
Sep 6, 2011
Sold by
Campbell Vincent E
Bought by
Us Bank Trust
Purchase Details
Closed on
Jan 30, 2007
Sold by
Not Provided
Bought by
Campbell Vincent E
Home Financials for this Owner
Home Financials are based on the most recent Mortgage that was taken out on this home.
Original Mortgage
$80,000
Interest Rate
6.08%
Mortgage Type
New Conventional
Create a Home Valuation Report for This Property
The Home Valuation Report is an in-depth analysis detailing your home's value as well as a comparison with similar homes in the area
Home Values in the Area
Average Home Value in this Area
Purchase History
| Date | Buyer | Sale Price | Title Company |
|---|---|---|---|
| Frazier Bernard | $110,000 | -- | |
| Powell Amos | $27,500 | -- | |
| Powell Amos | $27,500 | -- | |
| Us Bank Trust | $46,872 | -- | |
| Us Bank Trust National Associa | $46,872 | -- | |
| Campbell Vincent E | $80,000 | -- |
Source: Public Records
Mortgage History
| Date | Status | Borrower | Loan Amount |
|---|---|---|---|
| Open | Frazier Bernard | $108,007 | |
| Previous Owner | Campbell Vincent E | $80,000 |
Source: Public Records
Tax History Compared to Growth
Tax History
| Year | Tax Paid | Tax Assessment Tax Assessment Total Assessment is a certain percentage of the fair market value that is determined by local assessors to be the total taxable value of land and additions on the property. | Land | Improvement |
|---|---|---|---|---|
| 2025 | $1,556 | $74,480 | $18,000 | $56,480 |
| 2024 | $1,556 | $54,400 | $12,000 | $42,400 |
| 2023 | $1,762 | $57,000 | $12,000 | $45,000 |
| 2022 | $1,354 | $52,720 | $12,000 | $40,720 |
| 2021 | $1,405 | $40,840 | $7,200 | $33,640 |
| 2020 | $1,032 | $36,840 | $7,200 | $29,640 |
| 2019 | $1,032 | $30,240 | $7,200 | $23,040 |
| 2018 | $966 | $29,760 | $7,200 | $22,560 |
| 2017 | $962 | $30,280 | $7,200 | $23,080 |
| 2016 | $962 | $30,000 | $7,200 | $22,800 |
| 2015 | $985 | $30,680 | $7,200 | $23,480 |
| 2014 | $1,417 | $31,160 | $0 | $0 |
Source: Public Records
Map
Nearby Homes
- 230 Byck Ave
- 202 Byck Ave
- 64 Lee Ave
- 17 Russell Ave
- 4120 6th St
- 5021 Augusta Rd
- 123 Camellia Ave
- 169 Varnedoe Ave
- 4009 4th St
- 4116 Old Louisville Rd
- 97 Azalea Ave
- 0 Water Oak Way Unit SA339388
- 13 Ronnie Ave
- 117 Bowman Ave
- 171 Smith Ave
- 0 Old Louisville Rd Unit SA333709
- 3503 Haslam Ave
- 34 Smith Ave
- 2406 Shaw Ave
- 0 Roberts St Unit SA344423
- 212 Olmstead Place
- 204 Olmstead Place
- 216 Olmstead Place
- 213 Olmstead Place
- 209 Olmstead Place
- 104 Byck Ave
- 209 Chatham Villa Dr
- 213 Chatham Villa Dr
- 108 Byck Ave
- 217 Olmstead Place
- 205 Chatham Villa Dr
- 220 Olmstead Place
- 217 Chatham Villa Dr
- 205 Olmstead Place
- 100 Byck Ave
- 0 Chatham Villa Dr Unit 8825616
- 218 Byck Ave
- 221 Olmstead Place
- 221 Chatham Villa Dr
- 204 Byck Ave