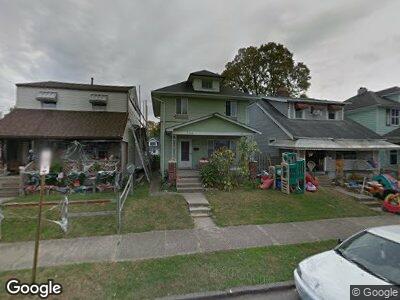
208 S Richardson Ave Columbus, OH 43204
Central Hilltop NeighborhoodEstimated Value: $152,000 - $169,000
2
Beds
1
Bath
1,160
Sq Ft
$139/Sq Ft
Est. Value
About This Home
This home is located at 208 S Richardson Ave, Columbus, OH 43204 and is currently estimated at $160,877, approximately $138 per square foot. 208 S Richardson Ave is a home located in Franklin County with nearby schools including Burroughs Elementary School, Hilltonia Middle School, and Briggs High School.
Ownership History
Date
Name
Owned For
Owner Type
Purchase Details
Closed on
Sep 23, 2020
Sold by
Dufour Mark
Bought by
Weber Cynthia Keri
Current Estimated Value
Home Financials for this Owner
Home Financials are based on the most recent Mortgage that was taken out on this home.
Original Mortgage
$6,050
Outstanding Balance
$5,439
Interest Rate
2.87%
Mortgage Type
New Conventional
Estimated Equity
$155,438
Purchase Details
Closed on
Jul 13, 2001
Sold by
Price Vivian J
Bought by
Dufour Mark
Home Financials for this Owner
Home Financials are based on the most recent Mortgage that was taken out on this home.
Original Mortgage
$57,103
Interest Rate
7.27%
Mortgage Type
FHA
Purchase Details
Closed on
May 5, 1987
Bought by
Price Vivian J
Create a Home Valuation Report for This Property
The Home Valuation Report is an in-depth analysis detailing your home's value as well as a comparison with similar homes in the area
Home Values in the Area
Average Home Value in this Area
Purchase History
| Date | Buyer | Sale Price | Title Company |
|---|---|---|---|
| Weber Cynthia Keri | $121,000 | Title Connect Agency | |
| Dufour Mark | $58,000 | Titlequest Agency Inc | |
| Price Vivian J | -- | -- |
Source: Public Records
Mortgage History
| Date | Status | Borrower | Loan Amount |
|---|---|---|---|
| Open | Weber Cynthia Keri | $6,050 | |
| Closed | Weber Cynthia Keri | $6,050 | |
| Open | Weber Cynthia Keri | $117,370 | |
| Previous Owner | Dufour Mark | $59,077 | |
| Previous Owner | Dufour Mark | $57,103 |
Source: Public Records
Tax History Compared to Growth
Tax History
| Year | Tax Paid | Tax Assessment Tax Assessment Total Assessment is a certain percentage of the fair market value that is determined by local assessors to be the total taxable value of land and additions on the property. | Land | Improvement |
|---|---|---|---|---|
| 2024 | $2,158 | $48,090 | $5,250 | $42,840 |
| 2023 | $2,131 | $48,090 | $5,250 | $42,840 |
| 2022 | $1,815 | $35,000 | $1,750 | $33,250 |
| 2021 | $1,819 | $35,000 | $1,750 | $33,250 |
| 2020 | $692 | $13,300 | $1,750 | $11,550 |
| 2019 | $658 | $10,850 | $1,470 | $9,380 |
| 2018 | $762 | $10,850 | $1,470 | $9,380 |
| 2017 | $807 | $10,850 | $1,470 | $9,380 |
| 2016 | $955 | $14,420 | $3,640 | $10,780 |
| 2015 | $867 | $14,420 | $3,640 | $10,780 |
| 2014 | $869 | $14,420 | $3,640 | $10,780 |
| 2013 | $504 | $16,940 | $4,270 | $12,670 |
Source: Public Records
Map
Nearby Homes
- 212 S Richardson Ave
- 261 S Terrace Ave
- 246 S Burgess Ave
- 271 S Terrace Ave
- 126 S Richardson Ave
- 247-249 S Eureka Ave
- 156 S Eureka Ave
- 312 S Richardson Ave
- 152 S Eureka Ave
- 148 S Eureka Ave
- 329 S Terrace Ave
- 96 S Eureka Ave
- 259 S Warren Ave
- 2710 Palmetto St
- 373 S Terrace Ave
- 79 S Ogden Ave
- 337 S Wayne Ave
- 204 S Harris Ave
- 350 S Ogden Ave
- 385 S Richardson Ave
- 208 S Richardson Ave
- 204 S Richardson Ave
- 216 S Richardson Ave
- 220 S Richardson Ave
- 192 S Richardson Ave
- 224 S Richardson Ave
- 188 S Richardson Ave
- 209 S Terrace Ave
- 203 S Terrace Ave
- 228 S Richardson Ave
- 215 S Terrace Ave
- 219 S Terrace Ave
- 184 S Richardson Ave
- 232 S Richardson Ave
- 207 S Richardson Ave
- 223 S Terrace Ave
- 211 S Richardson Ave
- 203 S Richardson Ave
- 215 S Richardson Ave
- 180 S Richardson Ave