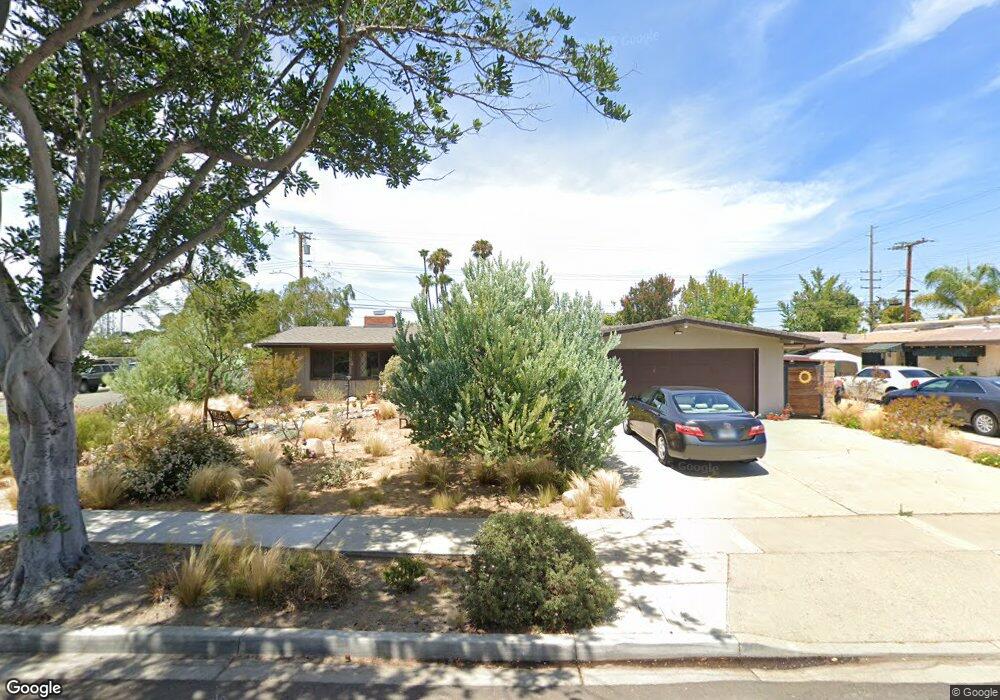
208 Wake Forest Rd Costa Mesa, CA 92626
Estimated Value: $1,307,068 - $1,564,000
3
Beds
2
Baths
1,587
Sq Ft
$935/Sq Ft
Est. Value
About This Home
This home is located at 208 Wake Forest Rd, Costa Mesa, CA 92626 and is currently estimated at $1,484,517, approximately $935 per square foot. 208 Wake Forest Rd is a home located in Orange County with nearby schools including College Park Elementary School, Costa Mesa High School, and Page Academy.
Ownership History
Date
Name
Owned For
Owner Type
Purchase Details
Closed on
Jul 1, 2011
Sold by
Gaffney Julie A
Bought by
Gaffney Julie A and Julie A Gaffney Trust
Current Estimated Value
Home Financials for this Owner
Home Financials are based on the most recent Mortgage that was taken out on this home.
Original Mortgage
$172,000
Outstanding Balance
$12,891
Interest Rate
4.5%
Mortgage Type
New Conventional
Estimated Equity
$1,471,626
Purchase Details
Closed on
Jul 27, 2009
Sold by
Gaffney Julie A
Bought by
Not Provided
Purchase Details
Closed on
Oct 20, 1998
Sold by
Paul Willemsen and Paul Betty
Bought by
Gaffney Chris F and Gaffney Julie A
Home Financials for this Owner
Home Financials are based on the most recent Mortgage that was taken out on this home.
Original Mortgage
$176,000
Interest Rate
6.61%
Mortgage Type
Stand Alone First
Purchase Details
Closed on
Nov 15, 1995
Sold by
Willemsen Paul and Willemsen Betty
Bought by
Willemsen Paul and Willemsen Betty
Create a Home Valuation Report for This Property
The Home Valuation Report is an in-depth analysis detailing your home's value as well as a comparison with similar homes in the area
Purchase History
| Date | Buyer | Sale Price | Title Company |
|---|---|---|---|
| Gaffney Julie A | -- | None Available | |
| Gaffney Julie A | -- | Fidelity National Title | |
| Not Provided | -- | None Available | |
| Gaffney Chris F | $220,000 | California Counties Title Co | |
| Willemsen Paul | -- | -- |
Source: Public Records
Mortgage History
| Date | Status | Borrower | Loan Amount |
|---|---|---|---|
| Open | Gaffney Julie A | $172,000 | |
| Previous Owner | Gaffney Chris F | $176,000 |
Source: Public Records
Tax History
| Year | Tax Paid | Tax Assessment Tax Assessment Total Assessment is a certain percentage of the fair market value that is determined by local assessors to be the total taxable value of land and additions on the property. | Land | Improvement |
|---|---|---|---|---|
| 2025 | $4,495 | $344,884 | $252,795 | $92,089 |
| 2024 | $4,495 | $338,122 | $247,838 | $90,284 |
| 2023 | $4,320 | $331,493 | $242,979 | $88,514 |
| 2022 | $4,136 | $324,994 | $238,215 | $86,779 |
| 2021 | $3,991 | $318,622 | $233,544 | $85,078 |
| 2020 | $3,938 | $315,355 | $231,149 | $84,206 |
| 2019 | $3,853 | $309,172 | $226,617 | $82,555 |
| 2018 | $3,775 | $303,110 | $222,173 | $80,937 |
| 2017 | $3,713 | $297,167 | $217,817 | $79,350 |
| 2016 | $3,637 | $291,341 | $213,546 | $77,795 |
| 2015 | $3,600 | $286,965 | $210,338 | $76,627 |
| 2014 | $3,520 | $281,344 | $206,218 | $75,126 |
Source: Public Records
Map
Nearby Homes
- 2338 Bunker Hill Way
- 157 Yorktown Ln
- 2408 Saratoga Way
- 107 Yorktown Ln
- 2408 Minuteman Way
- 135 Morristown Ln
- 115 Morristown Ln
- 2234 Avalon St
- 2214 Rutgers Dr
- 250 Bucknell Rd
- 327 W Wilson St Unit 107
- 327 W Wilson St Unit 88
- 327 W Wilson St Unit 86
- 380 W Wilson St Unit B103
- 2563 Columbia Dr
- 2443 Fordham Dr
- 326 Princeton Dr
- 2400 Elden Ave Unit 12
- 168 23rd St Unit D
- 158 Cecil Place
- 204 Wake Forest Rd
- 209 Amherst Place
- 205 Amherst Place
- 216 Wake Forest Rd
- 200 Wake Forest Rd
- 209 Wake Forest Rd
- 217 Amherst Rd
- 205 Wake Forest Rd
- 201 Amherst Place
- 213 Wake Forest Rd
- 220 Wake Forest Rd
- 201 Wake Forest Rd
- 221 Amherst Rd
- 217 Wake Forest Rd
- 204 Amherst Place
- 224 Wake Forest Rd
- 2302 Columbia Dr
- 216 Amherst Rd
- 2300 Fairview Rd Unit J103
- 2300 Fairview Rd
Your Personal Tour Guide
Ask me questions while you tour the home.