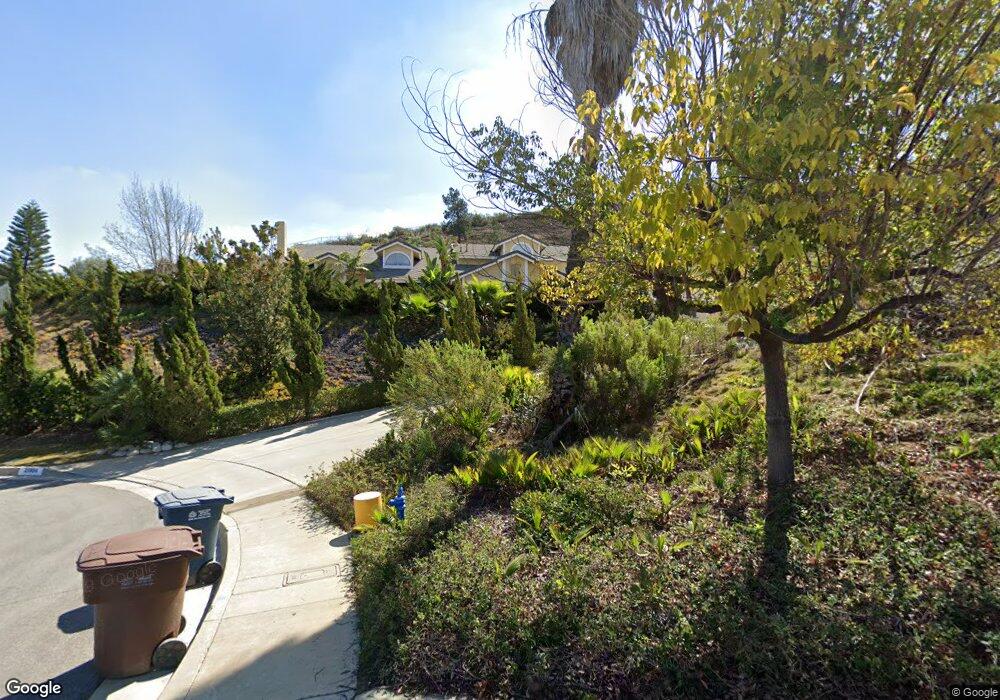
20804 Regency Ct Walnut, CA 91789
Estimated Value: $1,779,000 - $2,096,000
5
Beds
4
Baths
4,033
Sq Ft
$486/Sq Ft
Est. Value
About This Home
This home is located at 20804 Regency Ct, Walnut, CA 91789 and is currently estimated at $1,961,416, approximately $486 per square foot. 20804 Regency Ct is a home located in Los Angeles County with nearby schools including Leonard G. Westhoff Elementary School, Suzanne Middle School, and Walnut High School.
Ownership History
Date
Name
Owned For
Owner Type
Purchase Details
Closed on
Dec 2, 2009
Sold by
He Gang
Bought by
Liu Zikuan and Yang Hua
Current Estimated Value
Purchase Details
Closed on
May 4, 1999
Sold by
Lau Keven C
Bought by
He Gang and Yang Hong
Home Financials for this Owner
Home Financials are based on the most recent Mortgage that was taken out on this home.
Original Mortgage
$313,500
Interest Rate
6.9%
Purchase Details
Closed on
Feb 13, 1995
Sold by
Penalba Marcos A
Bought by
Lau Keven Chung Ching and Lau Kitty Li
Home Financials for this Owner
Home Financials are based on the most recent Mortgage that was taken out on this home.
Original Mortgage
$270,000
Interest Rate
6.75%
Create a Home Valuation Report for This Property
The Home Valuation Report is an in-depth analysis detailing your home's value as well as a comparison with similar homes in the area
Home Values in the Area
Average Home Value in this Area
Purchase History
| Date | Buyer | Sale Price | Title Company |
|---|---|---|---|
| Liu Zikuan | $1,048,000 | Cctn | |
| He Gang | $418,000 | Benefit Land Title Company | |
| Lau Keven Chung Ching | $390,000 | South Coast Title Company |
Source: Public Records
Mortgage History
| Date | Status | Borrower | Loan Amount |
|---|---|---|---|
| Previous Owner | He Gang | $313,500 | |
| Previous Owner | Lau Keven Chung Ching | $270,000 |
Source: Public Records
Tax History
| Year | Tax Paid | Tax Assessment Tax Assessment Total Assessment is a certain percentage of the fair market value that is determined by local assessors to be the total taxable value of land and additions on the property. | Land | Improvement |
|---|---|---|---|---|
| 2025 | $17,562 | $1,352,768 | $645,406 | $707,362 |
| 2024 | $16,681 | $1,326,244 | $632,751 | $693,493 |
| 2023 | $16,241 | $1,300,241 | $620,345 | $679,896 |
| 2022 | $15,868 | $1,274,747 | $608,182 | $666,565 |
| 2021 | $15,578 | $1,249,753 | $596,257 | $653,496 |
| 2019 | $15,097 | $1,212,687 | $578,573 | $634,114 |
| 2018 | $14,476 | $1,188,910 | $567,229 | $621,681 |
| 2016 | $13,423 | $1,142,745 | $545,203 | $597,542 |
| 2015 | $13,486 | $1,125,581 | $537,014 | $588,567 |
| 2014 | $13,544 | $1,103,533 | $526,495 | $577,038 |
Source: Public Records
Map
Nearby Homes
- 1359 Point Loma Place
- 1371 Point Loma Place
- 970 Estate Ct
- 931 Sky Meadow Place
- 973 Ichabod Way
- 805 Silver Valley Trail
- 16 Camelback
- 15 Camelback Dr
- 20672 Buckland Dr
- 21029 Stoddard Wells Rd
- 0 Gartel Dr
- 1668 Chestnut Hill Dr
- 1025 N Horseshoe Bend
- 20487 Gartel Dr
- 19933 Hidden Springs Rd
- 20033 E Skyline Dr
- 21111 Stockton Pass Rd
- 21529 Magnolia St
- 21530 Magnolia St
- 21819 E Chestnut Ct
- 20800 Regency Ct
- 20808 Regency Ct
- 20805 Regency Ct
- 20801 Regency Ct
- 1153 Regal Canyon Dr
- 20815 Regency Ct
- 1158 Sunset Bluff Rd
- 1162 Sunset Bluff Rd
- 20819 Regency Ct
- 1166 Sunset Bluff Rd
- 1150 Regal Canyon Dr
- 1158 Regal Canyon Dr
- 1142 Sunset Bluff Rd
- 1140 Regal Canyon Dr
- 1166 Regal Canyon Dr
- 1189 Regal Canyon Dr
- 1172 Sunset Bluff Rd
- 1131 Regal Canyon Dr
- 1157 Sunset Bluff Rd
- 1149 Sunset Bluff Rd
Your Personal Tour Guide
Ask me questions while you tour the home.