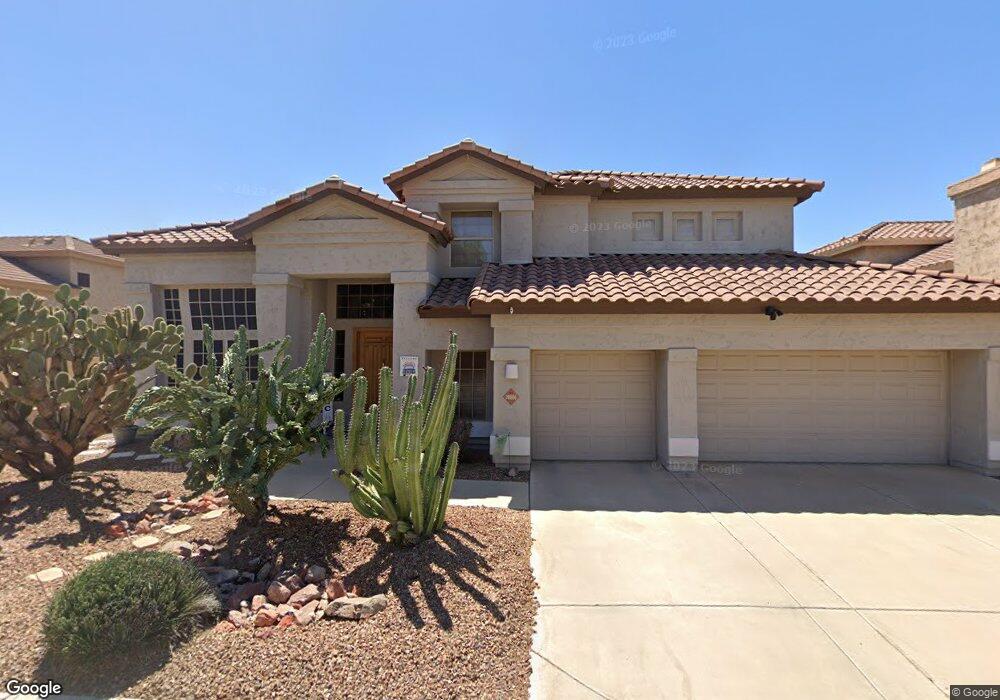
20806 N 16th Place Phoenix, AZ 85024
Desert View NeighborhoodEstimated Value: $729,016 - $901,000
--
Bed
3
Baths
3,089
Sq Ft
$270/Sq Ft
Est. Value
About This Home
This home is located at 20806 N 16th Place, Phoenix, AZ 85024 and is currently estimated at $834,254, approximately $270 per square foot. 20806 N 16th Place is a home located in Maricopa County with nearby schools including Boulder Creek Elementary School, Mountain Trail Middle School, and Pinnacle High School.
Ownership History
Date
Name
Owned For
Owner Type
Purchase Details
Closed on
Jan 5, 2005
Sold by
Boyer John C
Bought by
Miner Jeffrey L and Miner Lee Ann
Current Estimated Value
Home Financials for this Owner
Home Financials are based on the most recent Mortgage that was taken out on this home.
Original Mortgage
$250,000
Outstanding Balance
$126,138
Interest Rate
5.74%
Mortgage Type
New Conventional
Estimated Equity
$708,116
Purchase Details
Closed on
Feb 9, 2004
Sold by
Boyer Deborah D
Bought by
Boyer John C
Purchase Details
Closed on
Jul 23, 1996
Sold by
2728 Holding Corp
Bought by
Boyer John C and Boyer Deborah D
Home Financials for this Owner
Home Financials are based on the most recent Mortgage that was taken out on this home.
Original Mortgage
$247,100
Interest Rate
6.87%
Mortgage Type
New Conventional
Create a Home Valuation Report for This Property
The Home Valuation Report is an in-depth analysis detailing your home's value as well as a comparison with similar homes in the area
Home Values in the Area
Average Home Value in this Area
Purchase History
| Date | Buyer | Sale Price | Title Company |
|---|---|---|---|
| Miner Jeffrey L | $499,999 | Russ Lyon Title Llc | |
| Boyer John C | -- | -- | |
| Boyer John C | $264,663 | Lawyers Title Of Arizona Inc |
Source: Public Records
Mortgage History
| Date | Status | Borrower | Loan Amount |
|---|---|---|---|
| Open | Miner Jeffrey L | $250,000 | |
| Previous Owner | Boyer John C | $247,100 | |
| Closed | Miner Jeffrey L | $249,999 |
Source: Public Records
Tax History Compared to Growth
Tax History
| Year | Tax Paid | Tax Assessment Tax Assessment Total Assessment is a certain percentage of the fair market value that is determined by local assessors to be the total taxable value of land and additions on the property. | Land | Improvement |
|---|---|---|---|---|
| 2025 | $3,853 | $44,739 | -- | -- |
| 2024 | $3,760 | $42,609 | -- | -- |
| 2023 | $3,760 | $56,530 | $11,300 | $45,230 |
| 2022 | $3,716 | $43,700 | $8,740 | $34,960 |
| 2021 | $3,729 | $41,460 | $8,290 | $33,170 |
| 2020 | $3,595 | $38,930 | $7,780 | $31,150 |
| 2019 | $3,603 | $38,100 | $7,620 | $30,480 |
| 2018 | $3,472 | $36,810 | $7,360 | $29,450 |
| 2017 | $3,316 | $34,460 | $6,890 | $27,570 |
| 2016 | $3,264 | $33,710 | $6,740 | $26,970 |
| 2015 | $3,028 | $32,160 | $6,430 | $25,730 |
Source: Public Records
Map
Nearby Homes
- 1741 E Ross Ave
- 1705 E Rose Garden Ln
- 20621 N 17th St
- 1623 E Runion Dr
- 1701 E Yukon Dr
- 1500 E Wahalla Ln Unit W3
- 1321 E Escuda Dr
- 20826 N 10th St
- 20631 N 9th St
- 1723 E Pontiac Dr
- 922 E Blackhawk Dr
- 1023 E Escuda Dr
- 20616 N 8th St
- 758 E Irma Ln
- 21825 N 16th St
- 1443 E Wickieup Ln
- 1362 E Wickieup Ln
- 1313 E Piute Ave
- 1337 E Wickieup Ln
- 19426 N 15th Place
- 20812 N 16th Place
- 20668 N 16th Place
- 1618 E Monona Dr
- 20818 N 16th Place
- 20660 N 16th Place
- 1619 E Ross Ave
- 1624 E Monona Dr
- 20824 N 16th Place
- 20654 N 16th Place
- 20659 N 16th Place
- 1625 E Ross Ave
- 1630 E Monona Dr
- 20830 N 16th Place
- 20648 N 16th Place
- 1631 E Ross Ave
- 20651 N 16th Place
- 1620 E Ross Ave
- 20672 N 16th Way
- 1624 E Ross Ave
- 1634 E Monona Dr