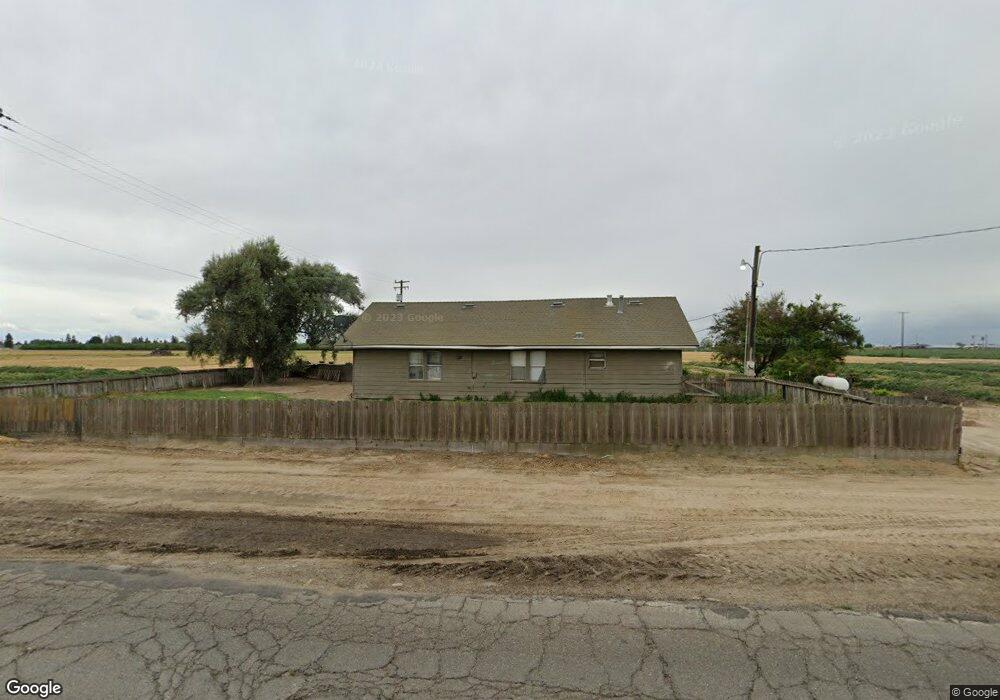
20819 August Ave Hilmar, CA 95324
Hilmar-Irwin NeighborhoodEstimated Value: $335,000 - $493,000
2
Beds
1
Bath
1,492
Sq Ft
$283/Sq Ft
Est. Value
About This Home
This home is located at 20819 August Ave, Hilmar, CA 95324 and is currently estimated at $421,815, approximately $282 per square foot. 20819 August Ave is a home located in Merced County with nearby schools including Hilmar High School.
Ownership History
Date
Name
Owned For
Owner Type
Purchase Details
Closed on
Nov 19, 2012
Sold by
Nyman Kathleen C and D & K Nyman 2011 Trust
Bought by
Nyman Kathleen C and D & K Nyman 2011 Trust Survivors
Current Estimated Value
Purchase Details
Closed on
Jul 15, 2011
Sold by
Nyman Lloyd
Bought by
Nyman Lloyd and Lloyd Nyman 2011 Trust
Purchase Details
Closed on
Jan 11, 2011
Sold by
Nyman Delton D and Nyman Kathleen C
Bought by
Nyman Delton D and Nyman Kathleen C
Purchase Details
Closed on
Oct 27, 2004
Sold by
Peterson Alan D and Peterson Michelle E
Bought by
Nyman Delton D and Nyman Kathleen C
Home Financials for this Owner
Home Financials are based on the most recent Mortgage that was taken out on this home.
Original Mortgage
$1,500,000
Outstanding Balance
$744,556
Interest Rate
5.7%
Mortgage Type
Purchase Money Mortgage
Estimated Equity
-$322,741
Purchase Details
Closed on
Dec 26, 2002
Sold by
Bucholtz Tresswa B
Bought by
Peterson Alan D and Peterson Michelle E
Home Financials for this Owner
Home Financials are based on the most recent Mortgage that was taken out on this home.
Original Mortgage
$295,725
Interest Rate
5.86%
Create a Home Valuation Report for This Property
The Home Valuation Report is an in-depth analysis detailing your home's value as well as a comparison with similar homes in the area
Home Values in the Area
Average Home Value in this Area
Purchase History
| Date | Buyer | Sale Price | Title Company |
|---|---|---|---|
| Nyman Kathleen C | -- | None Available | |
| Nyman Lloyd | -- | None Available | |
| Nyman Delton D | -- | None Available | |
| Nyman Delton D | $542,000 | Fidelity Title Company | |
| Nyman Bradford E | -- | Fidelity Title Company | |
| Peterson Alan D | -- | Transcounty Title Company |
Source: Public Records
Mortgage History
| Date | Status | Borrower | Loan Amount |
|---|---|---|---|
| Open | Nyman Bradford E | $1,500,000 | |
| Closed | Nyman Delton D | $1,500,000 | |
| Previous Owner | Peterson Alan D | $295,725 |
Source: Public Records
Tax History
| Year | Tax Paid | Tax Assessment Tax Assessment Total Assessment is a certain percentage of the fair market value that is determined by local assessors to be the total taxable value of land and additions on the property. | Land | Improvement |
|---|---|---|---|---|
| 2025 | $889 | $82,221 | $13,930 | $68,291 |
| 2024 | $889 | $80,609 | $13,657 | $66,952 |
| 2023 | $865 | $79,030 | $13,390 | $65,640 |
| 2022 | $852 | $77,481 | $13,128 | $64,353 |
| 2021 | $838 | $75,963 | $12,871 | $63,092 |
| 2020 | $833 | $75,186 | $12,740 | $62,446 |
| 2019 | $826 | $73,713 | $12,491 | $61,222 |
| 2018 | $757 | $72,269 | $12,247 | $60,022 |
| 2017 | $740 | $70,853 | $12,007 | $58,846 |
| 2016 | $726 | $69,465 | $11,772 | $57,693 |
| 2015 | $717 | $68,423 | $11,596 | $56,827 |
| 2014 | $700 | $67,083 | $11,369 | $55,714 |
Source: Public Records
Map
Nearby Homes
- 8686 Onyx Ct
- 8308 Rexford Dr
- 8139 Winfield Dr
- 8232 Shoreen St
- 19960 American Ave
- 19960 American Ave Unit 36
- 19960 American Ave Unit 4
- 19960 American Ave Unit 51
- 20292 Coral Cir
- 0 1st St Unit 224093393
- 0 1st St Unit 224093409
- 8683 Verona Way
- 7920 Cedar Ln
- 19667 American Ave Unit 42
- 7940 Lander Ave
- 19540 Dover Dr
- 7775 Klint Dr
- 19893 Lucas Ct
- 19061 Fowler Rd
- 0 Apn: 015-090-012-000 Unit 225130276
- 20936 August Ave
- 9135 Columbus Ave
- 20457 August Ave
- 20498 Amethyst Dr
- 20486 Amethyst Dr
- 8723 Songbird Way
- 8711 Songbird Way
- 20474 Amethyst Dr
- 8699 Songbird Way
- 20450 Amethyst Dr
- 8687 Songbird Way
- 20463 Amethyst Dr
- 20464 Amethyst Dr
- 8675 Songbird Way
- 20438 Amethyst Dr
- 8696 Songbird Way
- 8663 Songbird Way
- 20447 Amethyst Dr
- 20766 American Ave
- 8684 Songbird Way
Your Personal Tour Guide
Ask me questions while you tour the home.