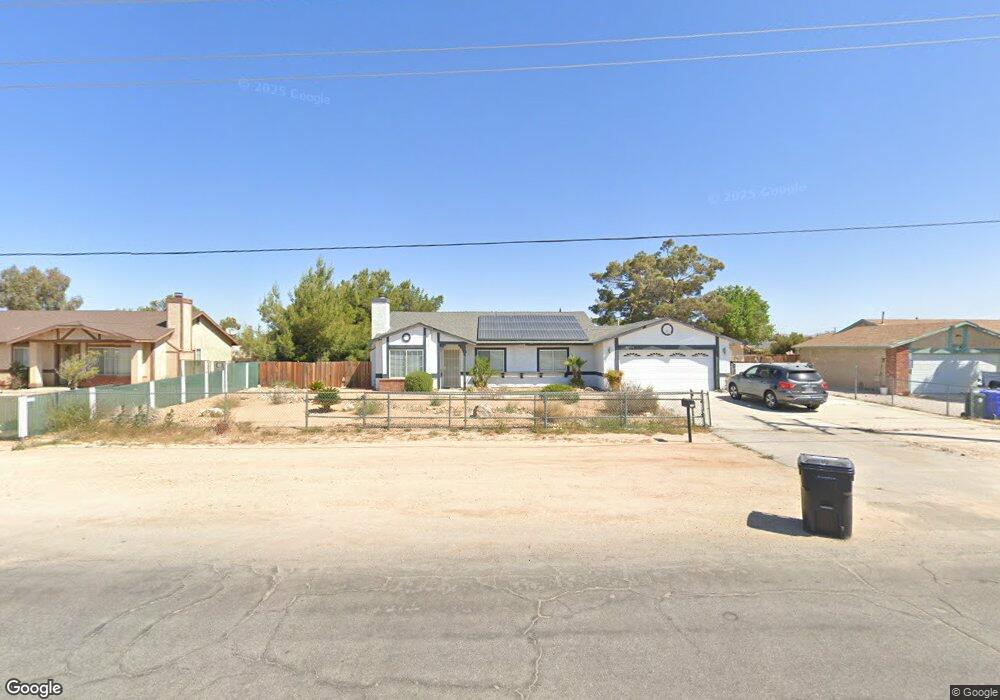
20838 Del Oro Rd Apple Valley, CA 92308
High Desert NeighborhoodEstimated Value: $427,000 - $459,000
4
Beds
2
Baths
1,963
Sq Ft
$226/Sq Ft
Est. Value
About This Home
This home is located at 20838 Del Oro Rd, Apple Valley, CA 92308 and is currently estimated at $443,329, approximately $225 per square foot. 20838 Del Oro Rd is a home located in San Bernardino County with nearby schools including Sandia Elementary School and Apple Valley High School.
Ownership History
Date
Name
Owned For
Owner Type
Purchase Details
Closed on
Aug 24, 2020
Sold by
Griego Angelo and Griego Christina A
Bought by
Griego Angelo
Current Estimated Value
Home Financials for this Owner
Home Financials are based on the most recent Mortgage that was taken out on this home.
Original Mortgage
$218,000
Outstanding Balance
$183,983
Interest Rate
2.71%
Mortgage Type
New Conventional
Estimated Equity
$259,346
Purchase Details
Closed on
Feb 19, 2014
Sold by
Fannie Mae
Bought by
Griego Angelo and Griego Christina A
Home Financials for this Owner
Home Financials are based on the most recent Mortgage that was taken out on this home.
Original Mortgage
$153,408
Interest Rate
4.47%
Mortgage Type
New Conventional
Purchase Details
Closed on
Jun 24, 2013
Sold by
Ramsey James
Bought by
Federal National Mortgage Association
Create a Home Valuation Report for This Property
The Home Valuation Report is an in-depth analysis detailing your home's value as well as a comparison with similar homes in the area
Home Values in the Area
Average Home Value in this Area
Purchase History
| Date | Buyer | Sale Price | Title Company |
|---|---|---|---|
| Griego Angelo | -- | Amrock Inc | |
| Griego Angelo | $161,500 | Lawyers Title | |
| Federal National Mortgage Association | $239,299 | Accommodation |
Source: Public Records
Mortgage History
| Date | Status | Borrower | Loan Amount |
|---|---|---|---|
| Open | Griego Angelo | $218,000 | |
| Closed | Griego Angelo | $153,408 |
Source: Public Records
Tax History Compared to Growth
Tax History
| Year | Tax Paid | Tax Assessment Tax Assessment Total Assessment is a certain percentage of the fair market value that is determined by local assessors to be the total taxable value of land and additions on the property. | Land | Improvement |
|---|---|---|---|---|
| 2025 | $2,469 | $219,856 | $39,591 | $180,265 |
| 2024 | $2,469 | $215,545 | $38,815 | $176,730 |
| 2023 | $2,445 | $211,319 | $38,054 | $173,265 |
| 2022 | $2,406 | $207,176 | $37,308 | $169,868 |
| 2021 | $2,350 | $203,113 | $36,576 | $166,537 |
| 2020 | $2,320 | $201,030 | $36,201 | $164,829 |
| 2019 | $2,276 | $197,088 | $35,491 | $161,597 |
| 2018 | $2,219 | $193,223 | $34,795 | $158,428 |
| 2017 | $2,187 | $189,435 | $34,113 | $155,322 |
| 2016 | $2,090 | $185,720 | $33,444 | $152,276 |
| 2015 | $1,856 | $164,709 | $32,942 | $131,767 |
| 2014 | $1,589 | $135,000 | $15,000 | $120,000 |
Source: Public Records
Map
Nearby Homes
- 65 Kiowa Place
- 20855 Otowi Rd
- 3 Del Oro Rd
- 10350 Merino Ave
- 11542 Chimayo Rd
- 11414 Serra Rd Unit 76
- 11414 Serra Rd Unit 73
- 11414 Serra Rd Unit 36
- 10990 Caribou Ave
- 11228 Mockingbird Ave
- 20489 Wren St
- 20990 Chama Rd
- 20911 Wren St
- 11651 Anza Rd
- 11550 Itoya Vista St
- 11507 Savage Ln
- 20375 Wadena Terrace
- 21055 Valencia St
- 26585 Del Oro Rd
- 21101 Sitkan Rd
- 20852 Del Oro Rd
- 20824 Del Oro Rd
- 20841 Otowi Rd
- 20868 Del Oro Rd
- 20808 Del Oro Rd
- 20827 Otowi Rd
- 20811 Otowi Rd
- 20871 Otowi Rd
- 20839 Del Oro Rd
- 20853 Del Oro Rd
- 20884 Del Oro Rd
- 20823 Del Oro Rd
- 20807 Del Oro Rd
- 20887 Otowi Rd
- 20794 Del Oro Rd
- 20885 Del Oro Rd
- 0 BearVall Kiowa Rd
- 20791 Del Oro Rd
- 20792 Otowi Rd