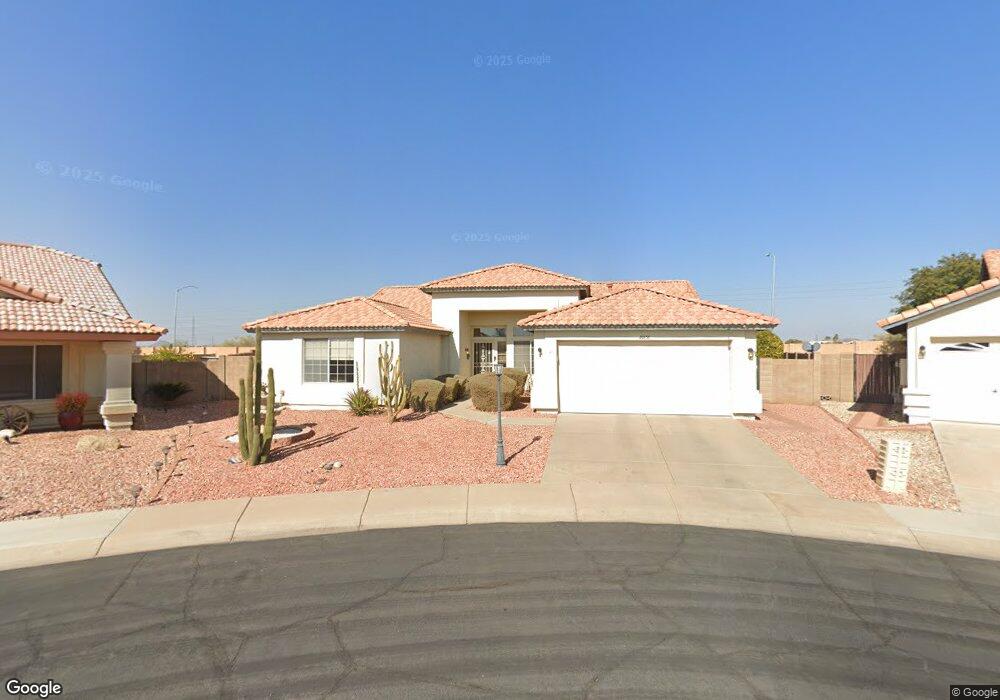
20838 N 109th Dr Sun City, AZ 85373
Estimated Value: $401,648 - $469,000
2
Beds
2
Baths
1,823
Sq Ft
$241/Sq Ft
Est. Value
About This Home
This home is located at 20838 N 109th Dr, Sun City, AZ 85373 and is currently estimated at $438,662, approximately $240 per square foot. 20838 N 109th Dr is a home located in Maricopa County with nearby schools including Parkridge Elementary School, Sunrise Mountain High School, and Candeo Peoria.
Ownership History
Date
Name
Owned For
Owner Type
Purchase Details
Closed on
Jan 21, 2019
Sold by
Easton Nicole Young
Bought by
Easton Nicole Young and Easton Peter S
Current Estimated Value
Purchase Details
Closed on
Apr 24, 1999
Sold by
Young Floyd T and Young Mary H
Bought by
Young Floyd T and Young Mary H
Purchase Details
Closed on
Jun 8, 1998
Sold by
Moravcik Mona Lee
Bought by
Young Floyd T and Young Mary H
Home Financials for this Owner
Home Financials are based on the most recent Mortgage that was taken out on this home.
Original Mortgage
$40,000
Interest Rate
7.17%
Mortgage Type
New Conventional
Purchase Details
Closed on
Apr 18, 1997
Sold by
Moravcik Mona Lee
Bought by
Moravcik Mona Lee
Purchase Details
Closed on
Jun 9, 1995
Sold by
Lennar Homes Of Arizona Inc
Bought by
Moravcik Mona Lee
Create a Home Valuation Report for This Property
The Home Valuation Report is an in-depth analysis detailing your home's value as well as a comparison with similar homes in the area
Home Values in the Area
Average Home Value in this Area
Purchase History
| Date | Buyer | Sale Price | Title Company |
|---|---|---|---|
| Easton Nicole Young | -- | None Available | |
| Easton Nicole Young | -- | None Available | |
| Young Floyd T | -- | -- | |
| Young Floyd T | $130,000 | Chicago Title Insurance Co | |
| Moravcik Mona Lee | -- | -- | |
| Moravcik Mona Lee | $123,805 | First Southwestern Title | |
| Lennar Homes Of Arizona Inc | -- | First Southwestern Title |
Source: Public Records
Mortgage History
| Date | Status | Borrower | Loan Amount |
|---|---|---|---|
| Closed | Young Floyd T | $40,000 |
Source: Public Records
Tax History Compared to Growth
Tax History
| Year | Tax Paid | Tax Assessment Tax Assessment Total Assessment is a certain percentage of the fair market value that is determined by local assessors to be the total taxable value of land and additions on the property. | Land | Improvement |
|---|---|---|---|---|
| 2025 | $1,779 | $21,071 | -- | -- |
| 2024 | $1,961 | $20,068 | -- | -- |
| 2023 | $1,961 | $30,620 | $6,120 | $24,500 |
| 2022 | $1,922 | $24,160 | $4,830 | $19,330 |
| 2021 | $2,011 | $23,100 | $4,620 | $18,480 |
| 2020 | $2,024 | $20,520 | $4,100 | $16,420 |
| 2019 | $1,965 | $19,450 | $3,890 | $15,560 |
| 2018 | $1,617 | $18,400 | $3,680 | $14,720 |
| 2017 | $1,619 | $16,180 | $3,230 | $12,950 |
| 2016 | $1,574 | $15,900 | $3,180 | $12,720 |
| 2015 | $1,495 | $15,060 | $3,010 | $12,050 |
Source: Public Records
Map
Nearby Homes
- 20641 N 110th Ave
- 10816 W Deanna Dr
- 10816 W Quail Ave
- 20957 N 107th Dr
- 10728 W Irma Ln
- 10722 W Irma Ln
- 10806 W Adam Ave
- 10952 W Tonopah Dr
- 10672 W Ross Ave
- 20769 N 106th Ln
- 11076 W Runion Dr
- 10763 W Runion Dr
- 20360 N 106th Ln
- 11002 W Yukon Dr
- 20323 N 110th Ln
- 10630 W Mohawk Ln
- 20670 N 105th Dr
- 10528 W Potter Dr
- 10659 W Yukon Dr
- 10549 W Albert Ln
- 20832 N 109th Dr
- 20837 N 109th Dr
- 20831 N 109th Dr
- 20825 N 110th Ave
- 10938 N Ventana Dr W
- 20831 N 110th Ave
- 20825 N 109th Dr
- 20844 N 109th Ave
- 20838 N 109th Ave
- 20819 N 110th Ave Unit 9
- 20832 N 109th Ave
- 20819 N 109th Dr
- 20826 N 109th Ave
- 20832 N 110th Ave
- 20807 N 110th Ave
- 20820 N 109th Ave Unit 9
- 11007 W Ventana Dr S
- 11011 W Ventana Dr S
- 10931 W Ventana Dr S
- 11001 N Ventana Dr W