2085 E 1550 Rd Lawrence, KS 66044
Estimated Value: $539,000 - $566,630
5
Beds
2
Baths
2,191
Sq Ft
$253/Sq Ft
Est. Value
About This Home
This home is located at 2085 E 1550 Rd, Lawrence, KS 66044 and is currently estimated at $555,210, approximately $253 per square foot. 2085 E 1550 Rd is a home located in Douglas County with nearby schools including Woodlawn Elementary School, Liberty Memorial Central Middle School, and Lawrence Free State High School.
Ownership History
Date
Name
Owned For
Owner Type
Purchase Details
Closed on
Oct 25, 2019
Sold by
The Boulton Family Trust
Bought by
Brown Rafe M
Current Estimated Value
Home Financials for this Owner
Home Financials are based on the most recent Mortgage that was taken out on this home.
Original Mortgage
$295,614
Outstanding Balance
$258,341
Interest Rate
3.7%
Mortgage Type
New Conventional
Estimated Equity
$296,869
Purchase Details
Closed on
Jun 15, 2012
Sold by
Boulton John B and Boulton Carole D
Bought by
Boulton John B and Boulton Carole D
Purchase Details
Closed on
May 26, 2010
Sold by
Vanvleck Frederick S
Bought by
Boulton John B and Boulton Carole D
Home Financials for this Owner
Home Financials are based on the most recent Mortgage that was taken out on this home.
Original Mortgage
$85,000
Interest Rate
5%
Mortgage Type
New Conventional
Create a Home Valuation Report for This Property
The Home Valuation Report is an in-depth analysis detailing your home's value as well as a comparison with similar homes in the area
Purchase History
| Date | Buyer | Sale Price | Title Company |
|---|---|---|---|
| Brown Rafe M | -- | Security 1St Title | |
| Boulton John B | -- | None Available | |
| Boulton John B | -- | Commerce Title |
Source: Public Records
Mortgage History
| Date | Status | Borrower | Loan Amount |
|---|---|---|---|
| Open | Brown Rafe M | $295,614 | |
| Previous Owner | Boulton John B | $85,000 |
Source: Public Records
Tax History
| Year | Tax Paid | Tax Assessment Tax Assessment Total Assessment is a certain percentage of the fair market value that is determined by local assessors to be the total taxable value of land and additions on the property. | Land | Improvement |
|---|---|---|---|---|
| 2025 | $6,674 | $57,672 | $11,095 | $46,577 |
| 2024 | $6,511 | $56,074 | $11,095 | $44,979 |
| 2023 | $6,150 | $51,175 | $10,244 | $40,931 |
| 2022 | $5,663 | $47,000 | $8,542 | $38,458 |
| 2021 | $4,797 | $38,605 | $8,542 | $30,063 |
| 2020 | $4,716 | $38,197 | $8,542 | $29,655 |
| 2019 | $2,790 | $22,699 | $2,970 | $19,729 |
| 2018 | $2,645 | $22,158 | $2,941 | $19,217 |
| 2017 | $2,635 | $21,823 | $2,932 | $18,891 |
| 2016 | $2,419 | $20,843 | $3,144 | $17,699 |
| 2015 | $2,432 | $20,837 | $3,138 | $17,699 |
| 2014 | $2,363 | $20,828 | $3,129 | $17,699 |
Source: Public Records
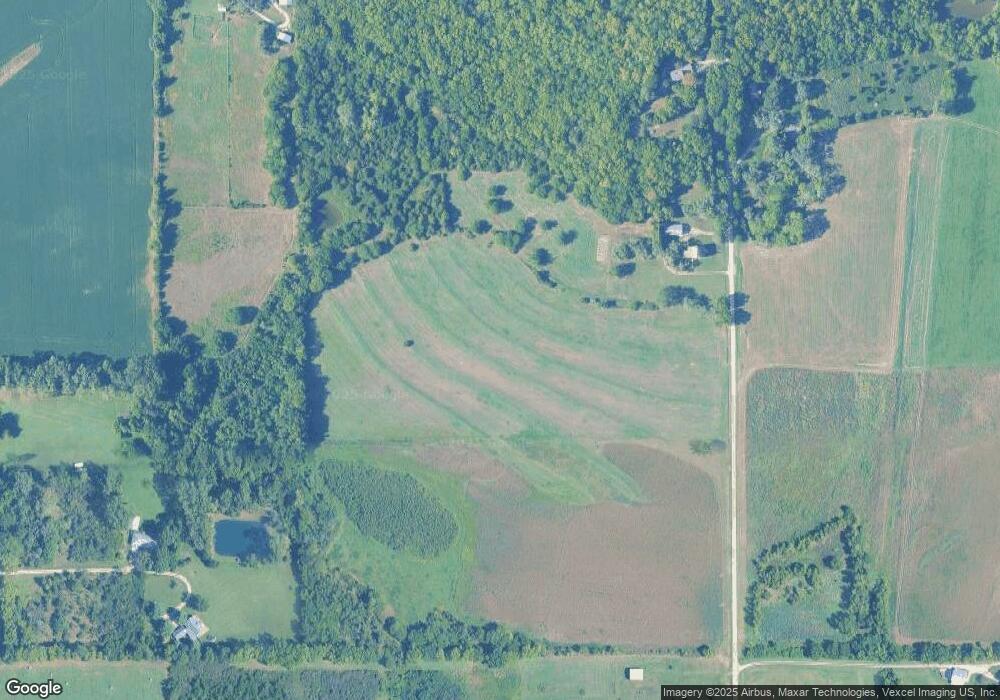
Map
Nearby Homes
- 1903 E 1400 Rd
- 1885 E 1700 Rd
- 0000 Chieftain Rd
- 1951 Wellman Rd
- 25139 Hemphill Rd
- 25293 Dehoff Dr
- Lot 13 Primrose Ln
- 12706 Ashley Ct
- 25523 Primrose Ln
- 1425 W Riverside Dr
- 1328 N 1770 Rd
- 1204 Sunchase Dr
- 1300 Sunchase Dr
- 25493 Kansas Ave
- 724 North St
- 606 North St
- 604 North St
- 00000 St
- Lot 28 Blue Moon Ln
- 17342 Blue Moon Ln
- 2078 E 1550 Rd
- 2073 E 1550 Rd
- 2095 E 1550 Rd
- 2086 E 1517 Rd
- 2090 E 1517 Rd
- 1514 N 2055 Rd
- 1521 N 2055 Rd
- 2034 E 1550 Rd
- 18742 1st St
- 18740 1st St
- 2065 E 1500 Rd
- 2049 E 1600 Rd
- 2026 E 1550 Rd
- 2022 E 1550 Rd
- 18524 1st St
- 2067 E 1500 Rd
- 1483 N 2100 Rd
- 18561 Northwind Rd
- 18561 Northwind Rd
- 18562 Northwind Dr
Your Personal Tour Guide
Ask me questions while you tour the home.