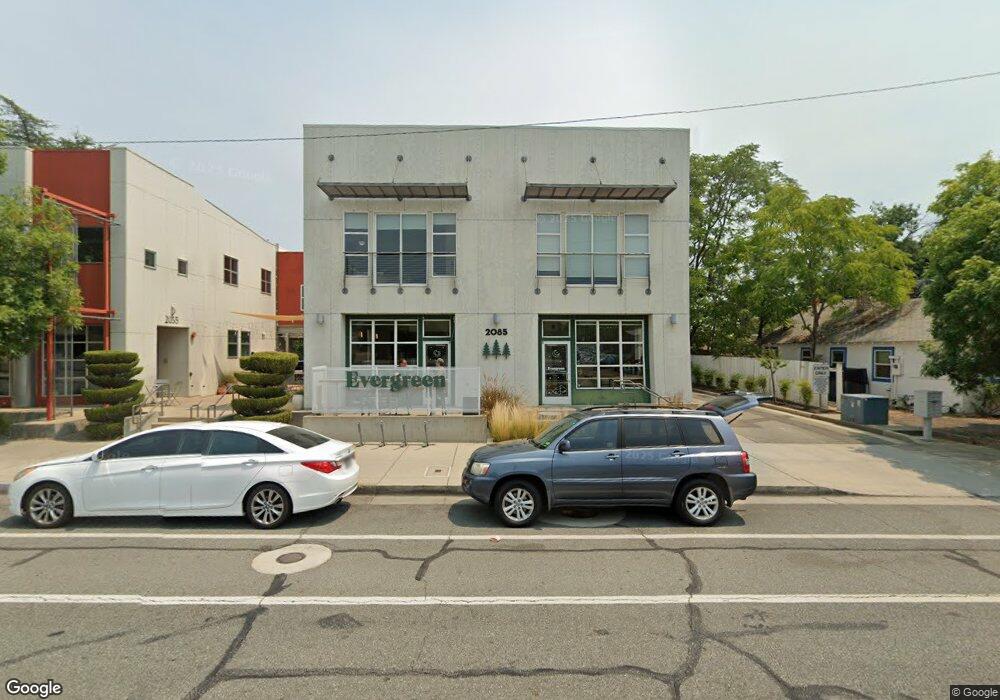
2085 Pine St Redding, CA 96001
Downtown Redding NeighborhoodEstimated Value: $895,438
2
Beds
1
Bath
3,848
Sq Ft
$233/Sq Ft
Est. Value
About This Home
This home is located at 2085 Pine St, Redding, CA 96001 and is currently estimated at $895,438, approximately $232 per square foot. 2085 Pine St is a home located in Shasta County with nearby schools including Juniper, Sequoia Middle School, and Shasta High School.
Ownership History
Date
Name
Owned For
Owner Type
Purchase Details
Closed on
Oct 25, 2023
Sold by
Diaz Jacqueline
Bought by
Antler Property Group Llc
Current Estimated Value
Purchase Details
Closed on
Jul 30, 2018
Sold by
Diaz Fernando R
Bought by
Diaz Jacqueline
Purchase Details
Closed on
Jul 23, 2018
Sold by
Innovations Housing Inc
Bought by
Diaz Jacqueline
Purchase Details
Closed on
Apr 15, 2010
Sold by
Koenigsaecker James G and Koenigsaecker Tynisha M
Bought by
Innovations Housing Inc
Purchase Details
Closed on
Aug 25, 2005
Sold by
Theimer James E and Noellert Rosemary
Bought by
Koenigsaecker James G and Koenigsaecker Tynisha M
Home Financials for this Owner
Home Financials are based on the most recent Mortgage that was taken out on this home.
Original Mortgage
$100,000
Interest Rate
5.61%
Mortgage Type
Commercial
Create a Home Valuation Report for This Property
The Home Valuation Report is an in-depth analysis detailing your home's value as well as a comparison with similar homes in the area
Home Values in the Area
Average Home Value in this Area
Purchase History
| Date | Buyer | Sale Price | Title Company |
|---|---|---|---|
| Antler Property Group Llc | $870,000 | Chicago Title Company | |
| Diaz Jacqueline | -- | Fidelity National Title Co O | |
| Diaz Jacqueline | $725,000 | Fidelity National Title Co O | |
| Innovations Housing Inc | $160,000 | Fidelity Natl Title Co Of Ca | |
| Koenigsaecker James G | $210,000 | Fidelity Natl Title Co Of Ca |
Source: Public Records
Mortgage History
| Date | Status | Borrower | Loan Amount |
|---|---|---|---|
| Previous Owner | Koenigsaecker James G | $100,000 |
Source: Public Records
Tax History
| Year | Tax Paid | Tax Assessment Tax Assessment Total Assessment is a certain percentage of the fair market value that is determined by local assessors to be the total taxable value of land and additions on the property. | Land | Improvement |
|---|---|---|---|---|
| 2025 | $9,131 | $887,400 | $204,000 | $683,400 |
| 2024 | $7,697 | $870,000 | $200,000 | $670,000 |
| 2023 | $7,697 | $729,095 | $192,996 | $536,099 |
| 2022 | $7,570 | $714,800 | $189,212 | $525,588 |
| 2021 | $7,536 | $700,785 | $185,502 | $515,283 |
| 2020 | $7,639 | $693,600 | $183,600 | $510,000 |
| 2019 | $7,251 | $680,000 | $180,000 | $500,000 |
| 2018 | $1,452 | $560,300 | $181,511 | $378,789 |
| 2017 | $1,445 | $549,314 | $177,952 | $371,362 |
| 2016 | $1,400 | $538,544 | $174,463 | $364,081 |
| 2015 | $1,383 | $530,456 | $171,843 | $358,613 |
| 2014 | $5,815 | $520,066 | $168,477 | $351,589 |
Source: Public Records
Map
Nearby Homes
- 1005 Gold St
- 2239 Garden Ave
- 0 California St Unit 25-5331
- 815 Locust St
- 1868 Gold St
- 2514 California St
- 3024 West St
- 2381/2401 West St
- 2330 West St
- 649 Lowe St
- 1012 State St
- 745 Parkview Ave
- 2036 Placer St
- 2077 Skyline Dr
- 1777 Magnolia Ave
- 2165 Paris Ave
- 864 Kite Ln
- 350 Park Marina Cir
- 1377 Willis St
- 1066 Pine St
Your Personal Tour Guide
Ask me questions while you tour the home.