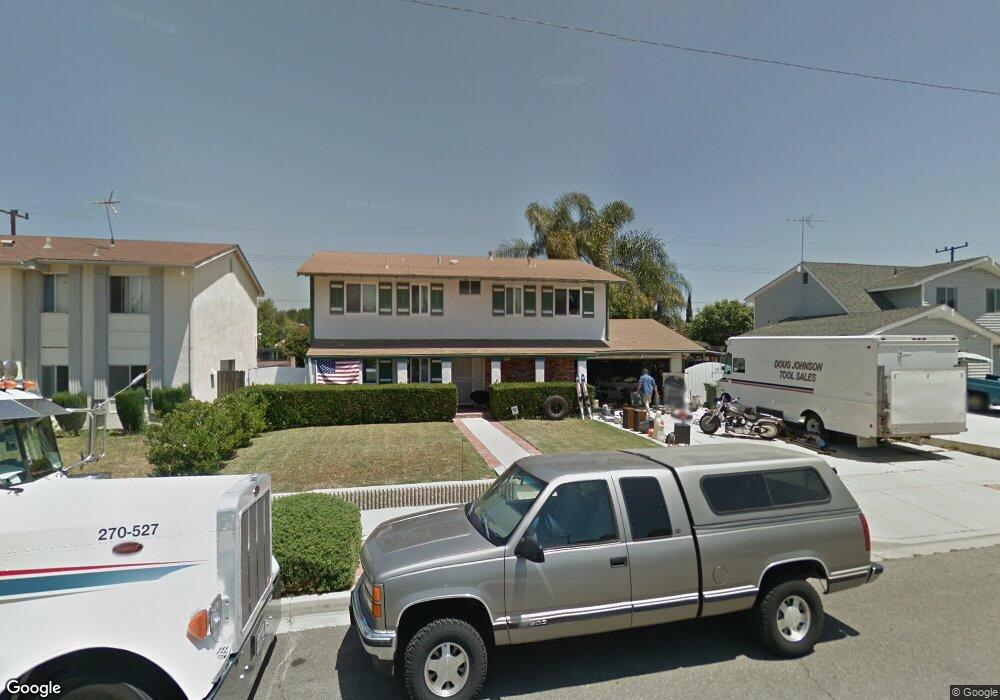
2089 Denny St Simi Valley, CA 93065
Central Simi Valley NeighborhoodEstimated Value: $774,885 - $859,000
4
Beds
3
Baths
1,725
Sq Ft
$471/Sq Ft
Est. Value
About This Home
This home is located at 2089 Denny St, Simi Valley, CA 93065 and is currently estimated at $812,971, approximately $471 per square foot. 2089 Denny St is a home located in Ventura County with nearby schools including Berylwood Elementary School, Hillside Middle School, and Royal High School.
Ownership History
Date
Name
Owned For
Owner Type
Purchase Details
Closed on
Aug 15, 1996
Sold by
Johnson Andrea B
Bought by
Johnson Douglas R
Current Estimated Value
Home Financials for this Owner
Home Financials are based on the most recent Mortgage that was taken out on this home.
Original Mortgage
$140,000
Interest Rate
7.53%
Create a Home Valuation Report for This Property
The Home Valuation Report is an in-depth analysis detailing your home's value as well as a comparison with similar homes in the area
Home Values in the Area
Average Home Value in this Area
Purchase History
| Date | Buyer | Sale Price | Title Company |
|---|---|---|---|
| Johnson Douglas R | -- | First American Title Ins Co |
Source: Public Records
Mortgage History
| Date | Status | Borrower | Loan Amount |
|---|---|---|---|
| Closed | Johnson Douglas R | $140,000 |
Source: Public Records
Tax History
| Year | Tax Paid | Tax Assessment Tax Assessment Total Assessment is a certain percentage of the fair market value that is determined by local assessors to be the total taxable value of land and additions on the property. | Land | Improvement |
|---|---|---|---|---|
| 2025 | $4,470 | $349,425 | $139,766 | $209,659 |
| 2024 | $4,470 | $342,574 | $137,025 | $205,549 |
| 2023 | $4,201 | $335,857 | $134,338 | $201,519 |
| 2022 | $4,169 | $329,272 | $131,704 | $197,568 |
| 2021 | $4,126 | $322,816 | $129,121 | $193,695 |
| 2020 | $4,031 | $319,508 | $127,798 | $191,710 |
| 2019 | $3,845 | $313,244 | $125,293 | $187,951 |
| 2018 | $3,804 | $307,103 | $122,837 | $184,266 |
| 2017 | $3,712 | $301,082 | $120,429 | $180,653 |
| 2016 | $3,542 | $295,179 | $118,068 | $177,111 |
| 2015 | $3,460 | $290,747 | $116,296 | $174,451 |
| 2014 | $3,403 | $285,054 | $114,019 | $171,035 |
Source: Public Records
Map
Nearby Homes
- 1636 Earl Ave
- 1904 Heywood St Unit L
- 1948 Heywood St Unit L
- 2108 N Brower St
- 2267 Morley St
- 2146 N Brower St
- 2399 Lee St
- 2091 Marter Ave
- 2349 Knollhaven St
- 2239 McDonald St
- 1755 Heywood St Unit 201
- 1755 Heywood St Unit 203
- 1882 Larch St
- 1740 Heywood St
- 2025 Royal Ave
- 1290 Lawrence Cir
- 2357 Lawnview Ct
- 2385 N Justin Ave
- 1776 Kearney Ave
- 1135 Donner Ave
- 2095 Denny St
- 2077 Denny St
- 2058 Morning Glory St
- 2064 Morning Glory St
- 2065 Denny St
- 2105 Denny St
- 2046 Morning Glory St
- 2076 Morning Glory St
- 2088 Denny St
- 2076 Denny St
- 2094 Denny St
- 2034 Morning Glory St
- 2088 Morning Glory St
- 2117 Denny St
- 2059 Denny St
- 2104 Denny St
- 2064 Denny St
- 2028 Morning Glory St
- 2094 Morning Glory St
- 2116 Denny St