2089 Denny St Simi Valley, CA 93065
Central Simi Valley NeighborhoodEstimated Value: $802,144 - $864,000
About This Home
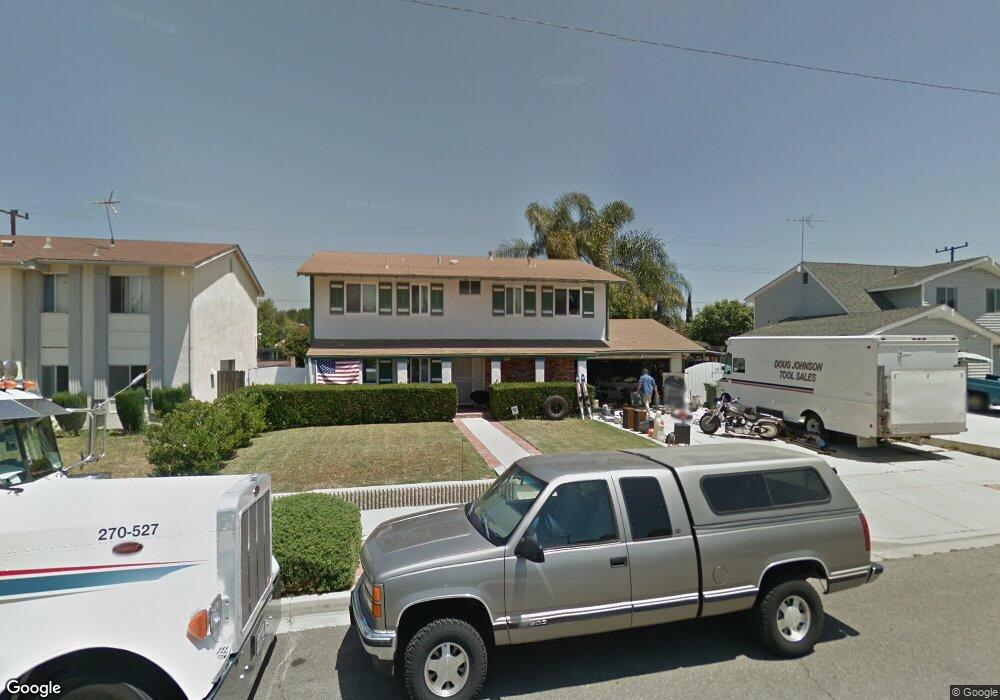
This home is located at 2089 Denny St, Simi Valley, CA 93065 and is currently estimated at $833,786, approximately $483 per square foot. 2089 Denny St is a home located in Ventura County with nearby schools including Berylwood Elementary School, Hillside Middle School, and Royal High School.
Ownership History
We collect this data history from publicly available records. To have your information removed, we recommend requesting removal directly through your county’s website.
Purchase Details
Home Financials for this Owner
Home Financials are based on the most recent Mortgage that was taken out on this home.Home Values in the Area
Average Home Value in this Area
Purchase History
We collect this data history from publicly available records. To have your information removed, we recommend requesting removal directly through your county’s website.
| Date | Buyer | Sale Price | Title Company |
|---|---|---|---|
| -- | First American Title Ins Co |
Mortgage History
We collect this data history from publicly available records. To have your information removed, we recommend requesting removal directly through your county’s website.
| Date | Status | Borrower | Loan Amount |
|---|---|---|---|
| Closed | $140,000 |
Tax History
We collect this data history from publicly available records. To have your information removed, we recommend requesting removal directly through your county’s website.
| Year | Tax Paid | Tax Assessment Tax Assessment Total Assessment is a certain percentage of the fair market value that is determined by local assessors to be the total taxable value of land and additions on the property. | Land | Improvement |
|---|---|---|---|---|
| 2025 | $4,470 | $349,425 | $139,766 | $209,659 |
| 2024 | $4,470 | $342,574 | $137,025 | $205,549 |
| 2023 | $4,201 | $335,857 | $134,338 | $201,519 |
| 2022 | $4,169 | $329,272 | $131,704 | $197,568 |
| 2021 | $4,126 | $322,816 | $129,121 | $193,695 |
| 2020 | $4,031 | $319,508 | $127,798 | $191,710 |
| 2019 | $3,845 | $313,244 | $125,293 | $187,951 |
| 2018 | $3,804 | $307,103 | $122,837 | $184,266 |
| 2017 | $3,712 | $301,082 | $120,429 | $180,653 |
| 2016 | $3,542 | $295,179 | $118,068 | $177,111 |
| 2015 | $3,460 | $290,747 | $116,296 | $174,451 |
| 2014 | $3,403 | $285,054 | $114,019 | $171,035 |
Map
- 2031 Morning Glory St
- 1908 Morley St
- 1904 Heywood St Unit L
- 2053 Malcolm St
- 1932 Heywood St Unit B
- 2235 Burnside St
- 1868 Cloud Ct
- 1755 Heywood St Unit 106
- 1755 Heywood St Unit 201
- 1755 Heywood St Unit 203
- 1740 Patricia Ave
- 2148 Elmdale Ave
- 2371 Larch St
- 1690 Heywood St Unit C
- 1692 Alviso St
- 2025 Royal Ave
- 1720 Anderson St
- 2357 Lawnview Ct
- 2311 Marvel Ave
- 2145 Cochran St
- 2077 Denny St
- 2095 Denny St
- 2058 Morning Glory St
- 2064 Morning Glory St
- 2065 Denny St
- 2105 Denny St
- 2046 Morning Glory St
- 2076 Morning Glory St
- 2088 Denny St
- 2076 Denny St
- 2094 Denny St
- 2034 Morning Glory St
- 2088 Morning Glory St
- 2059 Denny St
- 2117 Denny St
- 2064 Denny St
- 2104 Denny St
- 2028 Morning Glory St
- 2094 Morning Glory St
- 2058 Denny St
Ask me questions while you tour the home.