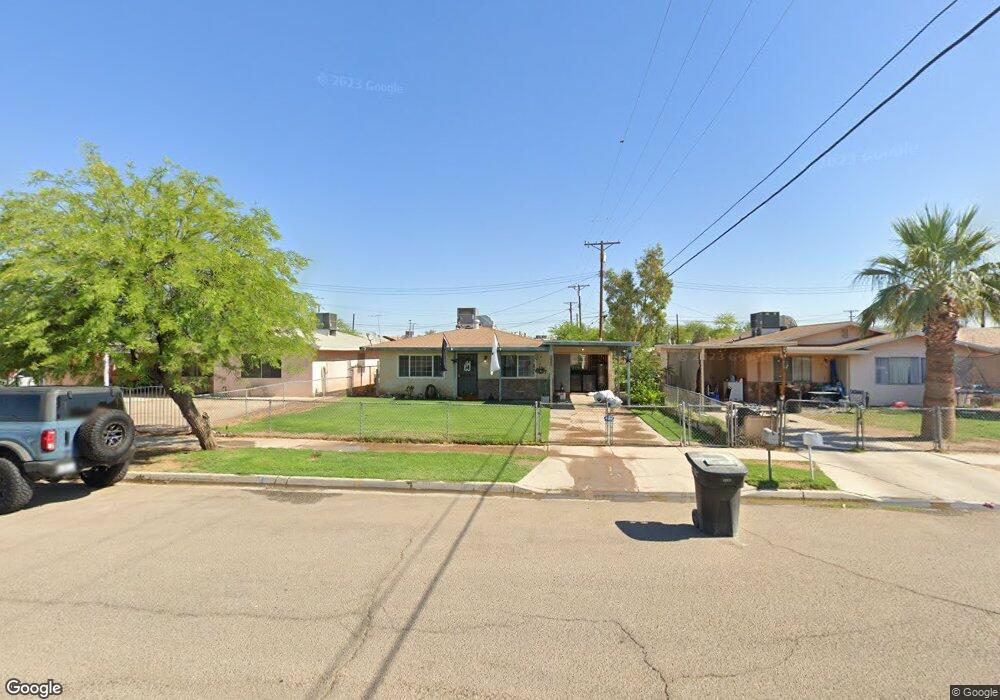
209 E 10th St Imperial, CA 92251
Estimated Value: $288,000 - $348,000
3
Beds
2
Baths
1,120
Sq Ft
$279/Sq Ft
Est. Value
About This Home
This home is located at 209 E 10th St, Imperial, CA 92251 and is currently estimated at $312,905, approximately $279 per square foot. 209 E 10th St is a home located in Imperial County with nearby schools including T.L. Waggoner Elementary School, Frank M. Wright Middle School, and Imperial High School.
Ownership History
Date
Name
Owned For
Owner Type
Purchase Details
Closed on
Jun 24, 2024
Sold by
Brand Frances D
Bought by
Frances Diana Brand Revocable Trust and Brand
Current Estimated Value
Purchase Details
Closed on
Apr 20, 2009
Sold by
Brand Frances D
Bought by
Brand Frances D
Home Financials for this Owner
Home Financials are based on the most recent Mortgage that was taken out on this home.
Original Mortgage
$65,800
Interest Rate
5.18%
Mortgage Type
New Conventional
Create a Home Valuation Report for This Property
The Home Valuation Report is an in-depth analysis detailing your home's value as well as a comparison with similar homes in the area
Purchase History
| Date | Buyer | Sale Price | Title Company |
|---|---|---|---|
| Frances Diana Brand Revocable Trust | -- | None Listed On Document | |
| Brand Frances D | -- | Chicago Title Company |
Source: Public Records
Mortgage History
| Date | Status | Borrower | Loan Amount |
|---|---|---|---|
| Previous Owner | Brand Frances D | $65,800 |
Source: Public Records
Tax History
| Year | Tax Paid | Tax Assessment Tax Assessment Total Assessment is a certain percentage of the fair market value that is determined by local assessors to be the total taxable value of land and additions on the property. | Land | Improvement |
|---|---|---|---|---|
| 2025 | $773 | $70,372 | $9,422 | $60,950 |
| 2023 | $773 | $67,641 | $9,057 | $58,584 |
| 2022 | $757 | $66,316 | $8,880 | $57,436 |
| 2021 | $745 | $65,016 | $8,706 | $56,310 |
| 2020 | $738 | $64,350 | $8,617 | $55,733 |
| 2019 | $728 | $63,090 | $8,449 | $54,641 |
| 2018 | $719 | $61,854 | $8,284 | $53,570 |
| 2017 | $677 | $60,642 | $8,122 | $52,520 |
| 2016 | $653 | $59,454 | $7,963 | $51,491 |
| 2015 | $660 | $58,562 | $7,844 | $50,718 |
| 2014 | $616 | $57,416 | $7,691 | $49,725 |
Source: Public Records
Map
Nearby Homes
- 509 N Imperial Ave
- 0 Newside 39a Unit 25618949IC
- 101 W 14th St Unit 105
- 602 S N St
- 601 E 10th St
- 120 W 5th St
- 0 N Imperial Ave
- 312 Chisolm Trail
- 405 S E St
- 501 S P St
- 1100 Rodeo Dr Unit 634
- 704 S H St
- 0 S P St
- 73 Redwood
- 713 S G St
- 717 S E St
- 1200 Rodeo Dr Unit 955
- 485 W Belford Rd
- 2575 Clark Rd
- 913 Fieldbrook Ct Unit 1
Your Personal Tour Guide
Ask me questions while you tour the home.