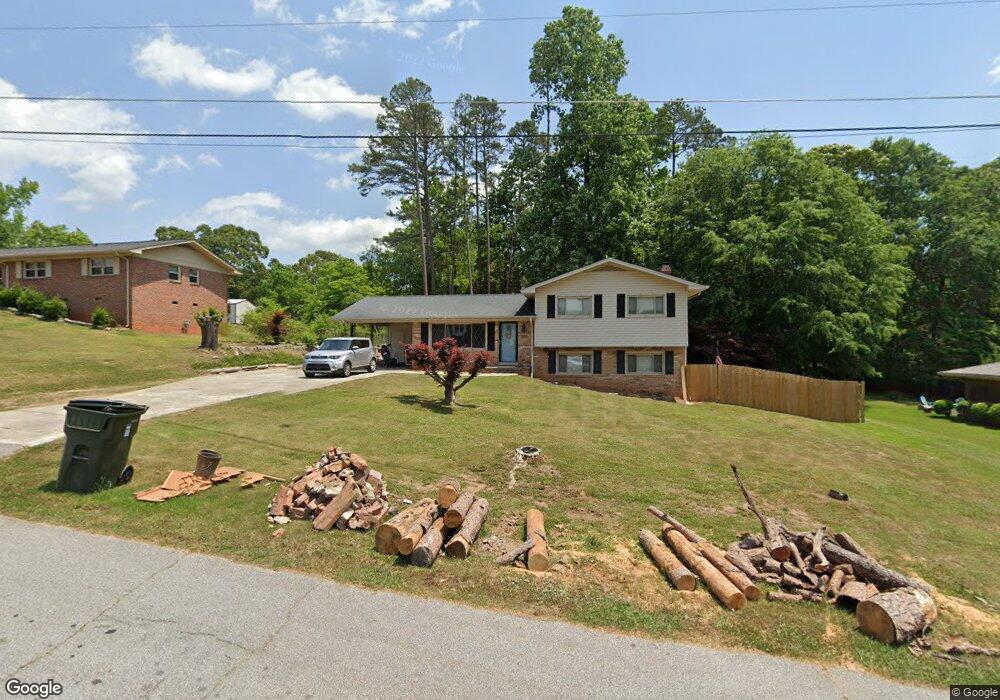
209 Julia Ln Toccoa, GA 30577
Estimated Value: $231,918 - $266,000
4
Beds
2
Baths
1,638
Sq Ft
$153/Sq Ft
Est. Value
About This Home
This home is located at 209 Julia Ln, Toccoa, GA 30577 and is currently estimated at $249,980, approximately $152 per square foot. 209 Julia Ln is a home located in Stephens County with nearby schools including Stephens County High School.
Ownership History
Date
Name
Owned For
Owner Type
Purchase Details
Closed on
Feb 25, 2021
Sold by
Young Jordan
Bought by
Defoor Joshua Bruce
Current Estimated Value
Home Financials for this Owner
Home Financials are based on the most recent Mortgage that was taken out on this home.
Original Mortgage
$161,616
Outstanding Balance
$143,886
Interest Rate
2.7%
Mortgage Type
New Conventional
Estimated Equity
$106,094
Purchase Details
Closed on
Sep 27, 2019
Sold by
King Vicky L
Bought by
Young Jordan and Dwyer Jennifer
Home Financials for this Owner
Home Financials are based on the most recent Mortgage that was taken out on this home.
Original Mortgage
$123,717
Interest Rate
3.5%
Mortgage Type
FHA
Purchase Details
Closed on
Sep 1, 2009
Sold by
Farley Douglas W
Bought by
King Vicky L
Purchase Details
Closed on
Oct 7, 2008
Sold by
Pless Janet Dianne
Bought by
Pless Frank W and Pless Janet Dianne
Purchase Details
Closed on
Jul 10, 2002
Bought by
<Buyer Info Not Present>
Purchase Details
Closed on
Mar 1, 1986
Bought by
<Buyer Info Not Present>
Create a Home Valuation Report for This Property
The Home Valuation Report is an in-depth analysis detailing your home's value as well as a comparison with similar homes in the area
Purchase History
| Date | Buyer | Sale Price | Title Company |
|---|---|---|---|
| Defoor Joshua Bruce | $159,300 | -- | |
| Young Jordan | $126,000 | -- | |
| King Vicky L | $107,400 | -- | |
| Pless Frank W | -- | -- | |
| <Buyer Info Not Present> | $100,000 | -- | |
| <Buyer Info Not Present> | $28,600 | -- |
Source: Public Records
Mortgage History
| Date | Status | Borrower | Loan Amount |
|---|---|---|---|
| Open | Defoor Joshua Bruce | $161,616 | |
| Previous Owner | Young Jordan | $123,717 |
Source: Public Records
Tax History
| Year | Tax Paid | Tax Assessment Tax Assessment Total Assessment is a certain percentage of the fair market value that is determined by local assessors to be the total taxable value of land and additions on the property. | Land | Improvement |
|---|---|---|---|---|
| 2025 | $2,754 | $92,761 | $2,275 | $90,486 |
| 2024 | $2,147 | $60,229 | $2,275 | $57,954 |
| 2023 | $1,977 | $55,901 | $2,275 | $53,626 |
| 2022 | $1,564 | $52,520 | $2,275 | $50,245 |
| 2021 | $1,515 | $48,459 | $2,275 | $46,184 |
| 2020 | $1,359 | $43,030 | $2,275 | $40,755 |
| 2019 | $1,038 | $32,722 | $2,275 | $30,447 |
| 2018 | $1,038 | $32,722 | $2,275 | $30,447 |
| 2017 | $1,054 | $32,722 | $2,275 | $30,447 |
| 2016 | $1,038 | $32,722 | $2,274 | $30,447 |
| 2015 | $1,078 | $32,456 | $2,274 | $30,181 |
| 2014 | $1,005 | $29,755 | $2,275 | $27,480 |
| 2013 | -- | $29,754 | $2,274 | $27,480 |
Source: Public Records
Map
Nearby Homes
- 189 Julia Ln
- 475 Hilltop Way
- 820 Collier Rd
- 926 Skyline Dr
- 43 Sycamore Dr
- 372 Hilltop Way
- 321 Quail Forest Cir
- 104-110 White Pine Rd
- 0 Valley Dr Unit 10600268
- 526 Poplar St
- 0 Stephen Dr Unit 10662201
- 103 Old Liberty Hill Rd
- 253 Stancil Dr
- 229 Hilltop Ln
- 122 King St
- 0 Brookhaven Cir Unit 10616964
- 551 P S Rd
- 1203 Mize Rd
- 27 Hilltop Ln
- 151 Richardson St
- 209 Julia Ln
- 231 Julia Ln
- 225 Julia Ln
- 220 Pebble Creek Dr
- 238 Pebble Creek Dr
- 198 Pebble Creek Dr
- 179 Julia Ln
- 212 Julia Ln
- 218 Julia Ln
- 198 Julia Ln
- 236 Julia Ln
- 265 Julia Ln
- 258 Pebble Creek Dr
- 178 Julia Ln
- 178 Pebble Creek Dr
- 161 Julia Ln
- 254 Julia Ln
- 166 Julia Ln
- 266 Pebble Creek Dr
- 158 Pebble Creek Dr
Your Personal Tour Guide
Ask me questions while you tour the home.