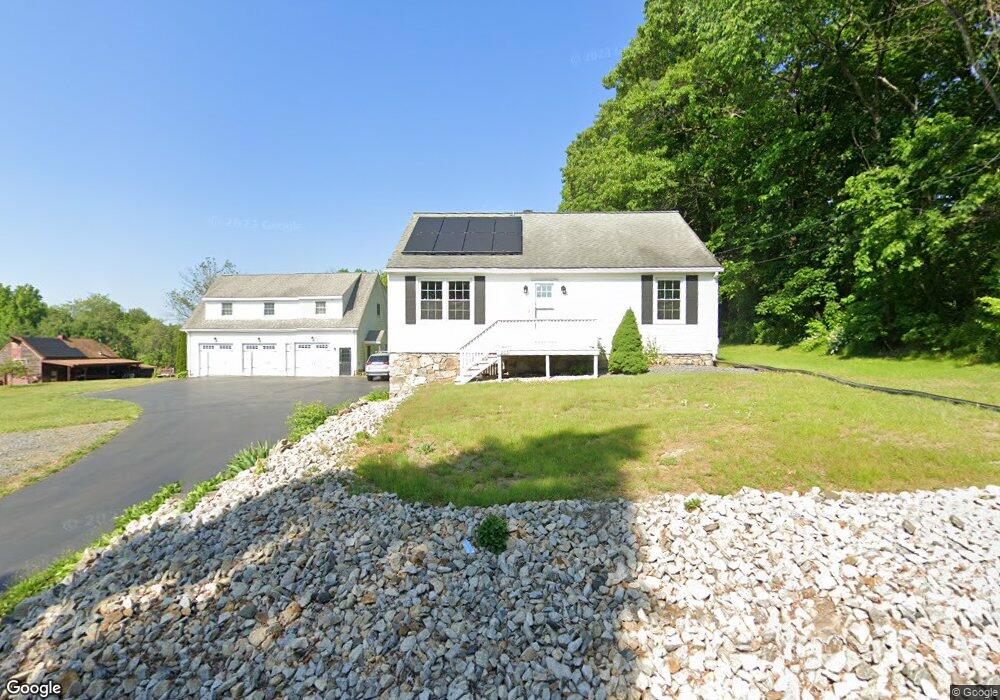
209 Mendon St Unit 209 Blackstone, MA 01504
Estimated Value: $644,000 - $744,005
3
Beds
1
Bath
2,900
Sq Ft
$238/Sq Ft
Est. Value
About This Home
This home is located at 209 Mendon St Unit 209, Blackstone, MA 01504 and is currently estimated at $690,001, approximately $237 per square foot. 209 Mendon St Unit 209 is a home located in Worcester County with nearby schools including Blackstone-Millville Regional High School.
Ownership History
Date
Name
Owned For
Owner Type
Purchase Details
Closed on
Apr 5, 2022
Sold by
Spellman Anthony J
Bought by
Spellman Ft 2022
Current Estimated Value
Purchase Details
Closed on
Mar 27, 2014
Sold by
Manzola Michael A and Manzola Jeannine
Bought by
Manzola Michael A
Purchase Details
Closed on
Oct 20, 2004
Sold by
Manzola Ft
Bought by
Manzola Jeannine and Manzola Michael A
Purchase Details
Closed on
Feb 7, 1992
Sold by
Romano Diana L
Bought by
Depointe Louis F
Home Financials for this Owner
Home Financials are based on the most recent Mortgage that was taken out on this home.
Original Mortgage
$32,500
Interest Rate
8.23%
Mortgage Type
Purchase Money Mortgage
Create a Home Valuation Report for This Property
The Home Valuation Report is an in-depth analysis detailing your home's value as well as a comparison with similar homes in the area
Home Values in the Area
Average Home Value in this Area
Purchase History
| Date | Buyer | Sale Price | Title Company |
|---|---|---|---|
| Spellman Ft 2022 | -- | None Available | |
| Manzola Michael A | -- | -- | |
| Manzola Jeannine | -- | -- | |
| Depointe Louis F | $32,500 | -- |
Source: Public Records
Mortgage History
| Date | Status | Borrower | Loan Amount |
|---|---|---|---|
| Previous Owner | Depointe Louis F | $32,500 |
Source: Public Records
Tax History Compared to Growth
Tax History
| Year | Tax Paid | Tax Assessment Tax Assessment Total Assessment is a certain percentage of the fair market value that is determined by local assessors to be the total taxable value of land and additions on the property. | Land | Improvement |
|---|---|---|---|---|
| 2025 | $9,842 | $651,800 | $177,000 | $474,800 |
| 2024 | $8,745 | $535,500 | $177,000 | $358,500 |
| 2023 | $8,329 | $514,800 | $177,000 | $337,800 |
| 2022 | $7,402 | $413,500 | $169,700 | $243,800 |
| 2021 | $7,290 | $389,400 | $154,200 | $235,200 |
| 2020 | $7,178 | $380,600 | $154,800 | $225,800 |
| 2019 | $7,000 | $370,200 | $142,100 | $228,100 |
| 2018 | $6,765 | $347,100 | $135,400 | $211,700 |
| 2017 | $6,485 | $336,700 | $135,400 | $201,300 |
| 2016 | $6,491 | $335,600 | $126,300 | $209,300 |
| 2015 | $6,524 | $334,900 | $126,300 | $208,600 |
Source: Public Records
Map
Nearby Homes