Estimated Value: $404,000 - $469,000
3
Beds
1
Bath
1,214
Sq Ft
$363/Sq Ft
Est. Value
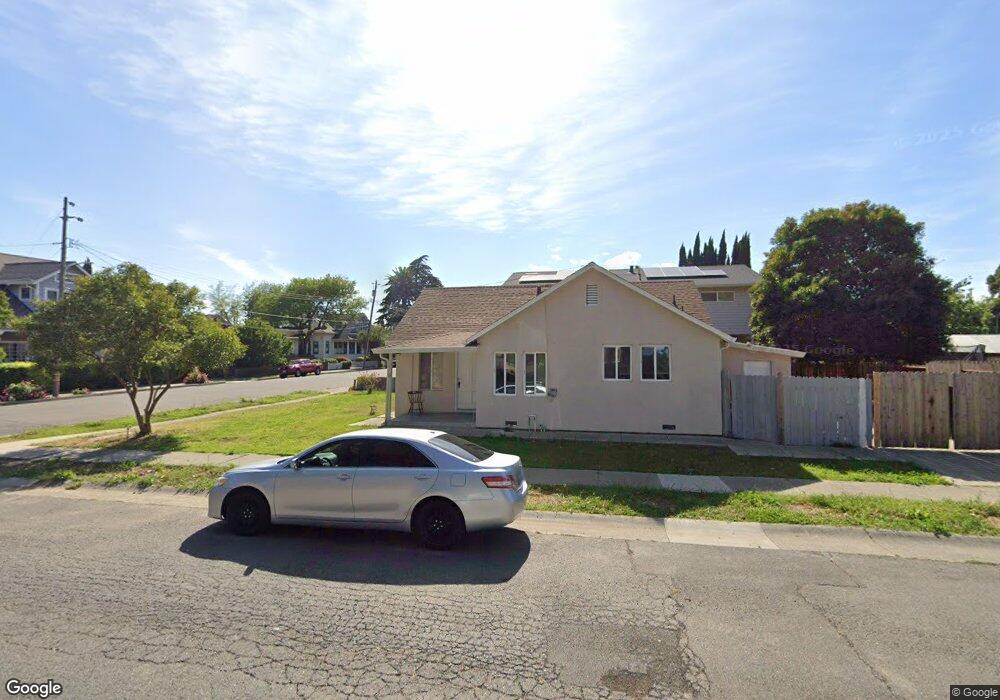
About This Home
This home is located at 209 N 4th St, Dixon, CA 95620 and is currently estimated at $440,857, approximately $363 per square foot. 209 N 4th St is a home located in Solano County with nearby schools including Anderson (Linford L.) Elementary School, Dixon High School, and Dixon Montessori Charter.
Ownership History
Date
Name
Owned For
Owner Type
Purchase Details
Closed on
Jan 22, 2014
Sold by
Figueroa Raul and Figueroa Teresa B
Bought by
Raul Figueroa & Teresa Figuero Trust and Figueroa Teresa
Current Estimated Value
Purchase Details
Closed on
Apr 26, 2002
Sold by
Bartok John
Bought by
Figueroa Raul and Figueroa Teresa B
Home Financials for this Owner
Home Financials are based on the most recent Mortgage that was taken out on this home.
Original Mortgage
$115,000
Outstanding Balance
$49,243
Interest Rate
7.13%
Estimated Equity
$391,614
Create a Home Valuation Report for This Property
The Home Valuation Report is an in-depth analysis detailing your home's value as well as a comparison with similar homes in the area
Home Values in the Area
Average Home Value in this Area
Purchase History
| Date | Buyer | Sale Price | Title Company |
|---|---|---|---|
| Raul Figueroa & Teresa Figuero Trust | -- | None Available | |
| Figueroa Raul | $160,000 | Frontier Title Company |
Source: Public Records
Mortgage History
| Date | Status | Borrower | Loan Amount |
|---|---|---|---|
| Open | Figueroa Raul | $115,000 |
Source: Public Records
Tax History
| Year | Tax Paid | Tax Assessment Tax Assessment Total Assessment is a certain percentage of the fair market value that is determined by local assessors to be the total taxable value of land and additions on the property. | Land | Improvement |
|---|---|---|---|---|
| 2025 | $2,626 | $236,356 | $73,857 | $162,499 |
| 2024 | $2,626 | $231,722 | $72,409 | $159,313 |
| 2023 | $2,548 | $227,180 | $70,990 | $156,190 |
| 2022 | $2,511 | $222,727 | $69,599 | $153,128 |
| 2021 | $2,481 | $218,361 | $68,235 | $150,126 |
| 2020 | $2,440 | $216,123 | $67,536 | $148,587 |
| 2019 | $2,395 | $211,886 | $66,212 | $145,674 |
| 2018 | $2,386 | $207,732 | $64,914 | $142,818 |
| 2017 | $2,327 | $203,660 | $63,642 | $140,018 |
| 2016 | $2,221 | $199,668 | $62,395 | $137,273 |
| 2015 | $2,170 | $196,670 | $61,458 | $135,212 |
| 2014 | $2,147 | $192,819 | $60,255 | $132,564 |
Source: Public Records
Map
Nearby Homes
Your Personal Tour Guide
Ask me questions while you tour the home.