Estimated Value: $391,000 - $550,000
3
Beds
1
Bath
1,832
Sq Ft
$270/Sq Ft
Est. Value
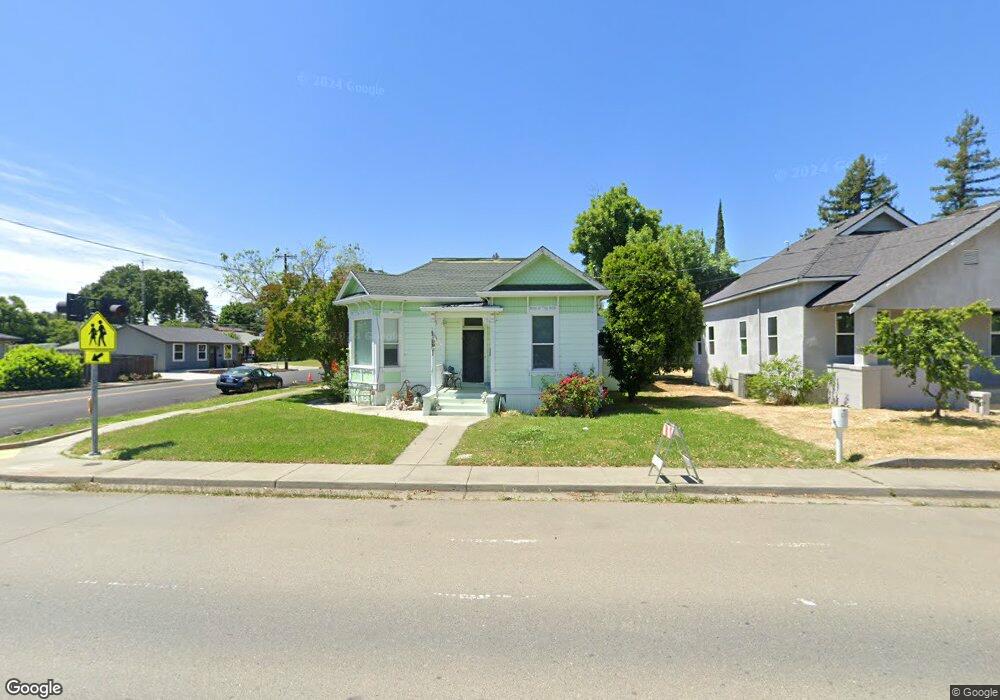
About This Home
This home is located at 209 N Adams St, Dixon, CA 95620 and is currently estimated at $494,989, approximately $270 per square foot. 209 N Adams St is a home located in Solano County with nearby schools including Anderson (Linford L.) Elementary School, Dixon High School, and Dixon Montessori Charter.
Ownership History
Date
Name
Owned For
Owner Type
Purchase Details
Closed on
Apr 22, 2002
Sold by
Coulter Dale and Coulter Carla
Bought by
Werley Patrick M and Werley Karen R
Current Estimated Value
Home Financials for this Owner
Home Financials are based on the most recent Mortgage that was taken out on this home.
Original Mortgage
$198,750
Outstanding Balance
$83,977
Interest Rate
7.08%
Mortgage Type
Stand Alone First
Estimated Equity
$411,012
Purchase Details
Closed on
Aug 9, 2000
Sold by
Beers Ronald L and Beers Roberta E
Bought by
Coulter Dale and Coulter Carla
Purchase Details
Closed on
Aug 15, 1995
Sold by
Beers Roberta E and Walser Roberta
Bought by
Beers Ronald Lee and Beers Roberta Eletha
Create a Home Valuation Report for This Property
The Home Valuation Report is an in-depth analysis detailing your home's value as well as a comparison with similar homes in the area
Home Values in the Area
Average Home Value in this Area
Purchase History
We collect this data history from publicly available records. To have your information removed, we recommend requesting removal directly through your county’s website.
| Date | Buyer | Sale Price | Title Company |
|---|---|---|---|
| Werley Patrick M | $159,000 | -- | |
| Coulter Dale | $75,000 | North American Title Co | |
| Beers Ronald Lee | -- | -- |
Source: Public Records
Mortgage History
We collect this data history from publicly available records. To have your information removed, we recommend requesting removal directly through your county’s website.
| Date | Status | Borrower | Loan Amount |
|---|---|---|---|
| Open | Werley Patrick M | $198,750 |
Source: Public Records
Tax History
| Year | Tax Paid | Tax Assessment Tax Assessment Total Assessment is a certain percentage of the fair market value that is determined by local assessors to be the total taxable value of land and additions on the property. | Land | Improvement |
|---|---|---|---|---|
| 2025 | $2,810 | $260,162 | $81,246 | $178,916 |
| 2024 | $2,810 | $255,061 | $79,653 | $175,408 |
| 2023 | $2,725 | $250,061 | $78,092 | $171,969 |
| 2022 | $2,684 | $245,159 | $76,561 | $168,598 |
| 2021 | $2,650 | $240,353 | $75,060 | $165,293 |
| 2020 | $2,606 | $237,890 | $74,291 | $163,599 |
| 2019 | $2,556 | $233,227 | $72,835 | $160,392 |
| 2018 | $2,545 | $228,655 | $71,407 | $157,248 |
| 2017 | $2,480 | $224,172 | $70,007 | $154,165 |
| 2016 | $2,366 | $219,778 | $68,635 | $151,143 |
| 2015 | $2,311 | $216,478 | $67,605 | $148,873 |
| 2014 | $2,286 | $212,238 | $66,281 | $145,957 |
Source: Public Records
Map
Nearby Homes
- 580 W B St
- 600 W C St
- 630 Marvin Way
- 241 S 1st St
- 255 Diane Place
- 610 Sierra Dr
- 10 Solano Dr
- 875 Sievers Way
- 730 Park Dr
- 390 S 3rd St
- 625 Cypress St
- 550 W Creekside Cir
- 1545 Patton Ct
- 655 W Creekside Cir
- 660 Berkshire Dr
- 1125 Arizona Ct
- 1250 Redwood Ct
- 970 Camelia Dr
- 640 E Creekside Cir
- 345 Alderglen Dr
Your Personal Tour Guide
Ask me questions while you tour the home.