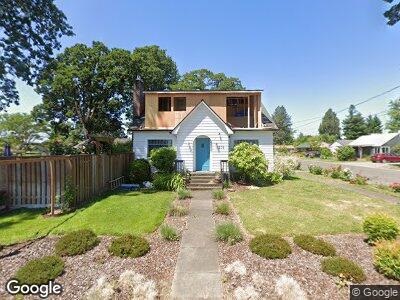
209 S 16th Ave Cornelius, OR 97113
Estimated Value: $547,000 - $628,000
3
Beds
2
Baths
2,828
Sq Ft
$209/Sq Ft
Est. Value
About This Home
This home is located at 209 S 16th Ave, Cornelius, OR 97113 and is currently estimated at $589,917, approximately $208 per square foot. 209 S 16th Ave is a home located in Washington County with nearby schools including Echo Shaw Elementary School, Neil Armstrong Middle School, and Tom McCall Upper Elementary School.
Ownership History
Date
Name
Owned For
Owner Type
Purchase Details
Closed on
Aug 2, 2016
Sold by
Sherwood Jason and Sherwood Heather
Bought by
Tarkinton James and Tarkinton Risa
Current Estimated Value
Home Financials for this Owner
Home Financials are based on the most recent Mortgage that was taken out on this home.
Original Mortgage
$308,750
Interest Rate
3.56%
Mortgage Type
New Conventional
Purchase Details
Closed on
Sep 26, 2013
Sold by
Albee Kurt J and Albee Elonda
Bought by
Sherwood Jason and Sherwood Heather
Home Financials for this Owner
Home Financials are based on the most recent Mortgage that was taken out on this home.
Original Mortgage
$231,600
Interest Rate
4.25%
Mortgage Type
FHA
Purchase Details
Closed on
Sep 27, 2010
Sold by
Albee Kurt J
Bought by
Albee Kurt J and Albee Elonda
Create a Home Valuation Report for This Property
The Home Valuation Report is an in-depth analysis detailing your home's value as well as a comparison with similar homes in the area
Home Values in the Area
Average Home Value in this Area
Purchase History
| Date | Buyer | Sale Price | Title Company |
|---|---|---|---|
| Tarkinton James | $325,000 | Wfg Title | |
| Sherwood Jason | $240,000 | Ticor Title Company | |
| Albee Kurt J | -- | None Available |
Source: Public Records
Mortgage History
| Date | Status | Borrower | Loan Amount |
|---|---|---|---|
| Open | Tarkinton James | $25,000 | |
| Open | Tarkinson James | $381,200 | |
| Closed | Tarkinton James | $25,000 | |
| Closed | Tarkinton James | $308,750 | |
| Previous Owner | Sherwood Jason | $208,000 | |
| Previous Owner | Sherwood Jason | $231,600 |
Source: Public Records
Tax History Compared to Growth
Tax History
| Year | Tax Paid | Tax Assessment Tax Assessment Total Assessment is a certain percentage of the fair market value that is determined by local assessors to be the total taxable value of land and additions on the property. | Land | Improvement |
|---|---|---|---|---|
| 2025 | $5,090 | $284,450 | -- | -- |
| 2024 | $3,736 | $311,900 | -- | -- |
| 2023 | $3,736 | $215,490 | $0 | $0 |
| 2022 | $3,310 | $215,490 | $0 | $0 |
| 2021 | $3,271 | $203,130 | $0 | $0 |
| 2020 | $3,259 | $197,220 | $0 | $0 |
| 2019 | $3,187 | $191,480 | $0 | $0 |
| 2018 | $3,089 | $185,910 | $0 | $0 |
| 2017 | $2,994 | $180,500 | $0 | $0 |
| 2016 | $2,910 | $175,250 | $0 | $0 |
| 2015 | $2,738 | $170,150 | $0 | $0 |
| 2014 | $2,643 | $165,200 | $0 | $0 |
Source: Public Records
Map
Nearby Homes
- 1599 S Alpine St
- 1701 S Alpine St
- 1450 S Cherry St
- 449 S 12th Ave
- 1371 S Ginger Ct
- 1427 N Davis St
- 1959 S Heather St
- 440 N 14th Ave
- 2023 S Jasper Dr
- 1126 S Jasper St
- 507 N 19th Ave Unit 2
- 507 N 19th Ave
- 507 N 19th Ave Unit 1
- 507 N 19th Ave Unit 7
- 507 N 19th Ave Unit 37
- 507 N 19th Ave Unit 15
- 642 S 23rd Ave
- 570 N 10th St Unit 29
- 570 N 10th Ave Unit 21
- 570 N 10th Ave Unit 75
- 209 S 16th Ave
- 1563 S Beech St
- 285 S 16th Ave
- 1584 S Cherry St
- 1596 S Beech St
- 179 S 16th Ave
- 1588 S Beech St
- 1554 S Beech St
- 1519 S Beech St
- 1534 S Cherry St
- 1499 S Beech St
- 1500 S Beech St
- 1599 S Cherry St
- 1589 S Cherry St
- 1563 S Cherry St
- 1555 S Alpine St
- 1549 S Cherry St
- 1498 S Cherry St
- 310 S 16th Ave
- 1467 S Beech St