
T
Seller's Agent in 2026
Thomas Hinkens
Hinkens Group Properties
(805) 757-3799
47 in this area
77 Total Sales

Estimated Value: $624,000 - $664,000
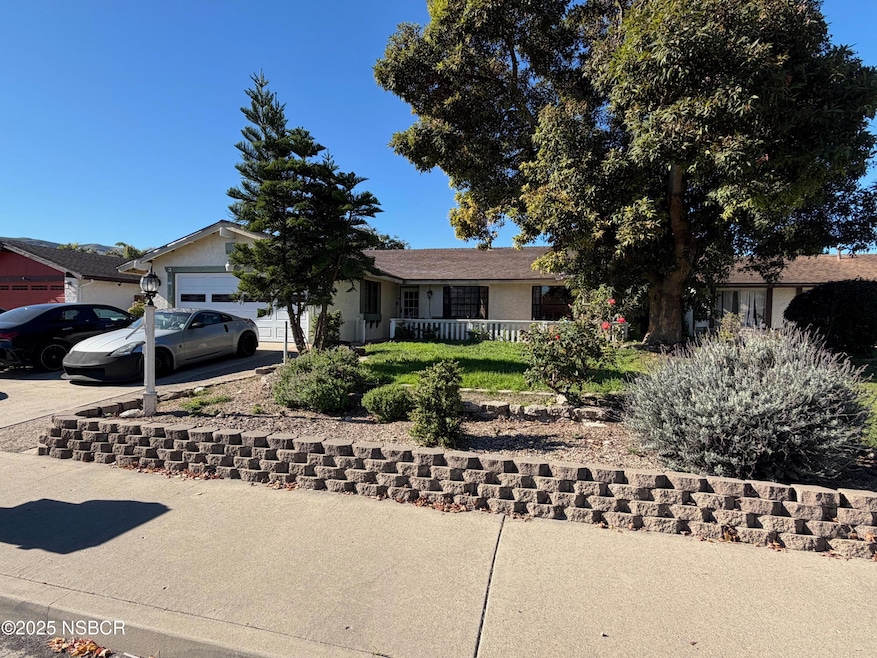
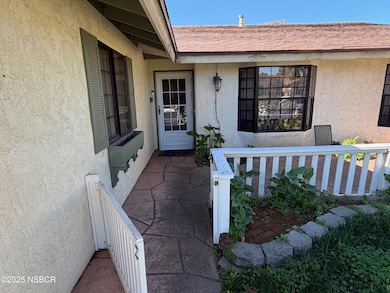
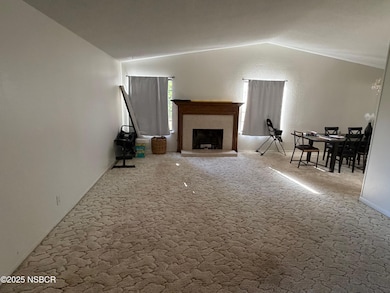
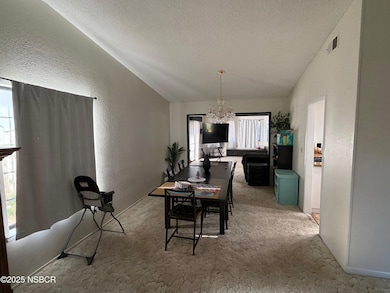
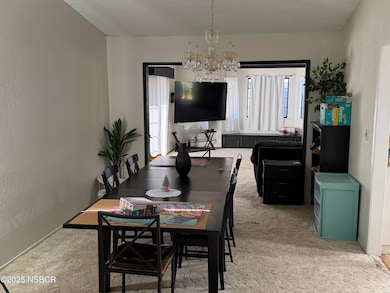
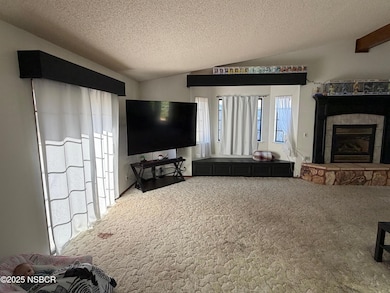
Welcome! This Beautiful 3 bedroom 2 bathroom home is located in a Cul-De-Sac on the south side of Lompoc. Freshly painted, newer kitchen in 2022. Home features a large family room perfect for entertaining or relaxing in front of the large fireplace. Large workshop in the backyard perfect for those that love to garden. Conveniently located close to the school and park. Don't miss out, call today!
Last Agent to Sell the Property
Hinkens Group Properties License #01890652 Listed on: 12/10/2025
We collect this data history from publicly available records. To have your information removed, we recommend requesting removal directly through your county’s website.
We collect this data history from publicly available records. To have your information removed, we recommend requesting removal directly through your county’s website.
| Date | Buyer | Sale Price | Title Company |
|---|---|---|---|
| $619,000 | Fidelity National Title Compan | ||
| $566,000 | First American Title | ||
| -- | Manweiler Sylvia |
We collect this data history from publicly available records. To have your information removed, we recommend requesting removal directly through your county’s website.
| Date | Status | Borrower | Loan Amount |
|---|---|---|---|
| Open | $495,200 | ||
| Previous Owner | $555,748 |
We collect this data history from publicly available records. To have your information removed, we recommend requesting removal directly through your county’s website.
| Date | Event | Price | List to Sale | Price per Sq Ft |
|---|---|---|---|---|
| 02/18/2026 02/18/26 | Sold | $619,000 | +1.6% | $286 / Sq Ft |
| 01/14/2026 01/14/26 | Pending | -- | -- | -- |
| 01/08/2026 01/08/26 | Price Changed | $609,000 | -1.3% | $281 / Sq Ft |
| 12/10/2025 12/10/25 | For Sale | $616,750 | -- | $285 / Sq Ft |
We collect this data history from publicly available records. To have your information removed, we recommend requesting removal directly through your county’s website.
| Year | Tax Paid | Tax Assessment Tax Assessment Total Assessment is a certain percentage of the fair market value that is determined by local assessors to be the total taxable value of land and additions on the property. | Land | Improvement |
|---|---|---|---|---|
| 2025 | $6,525 | $600,642 | $191,017 | $409,625 |
| 2023 | $6,525 | $538,000 | $171,000 | $367,000 |
| 2022 | $1,992 | $179,800 | $38,393 | $141,407 |
| 2021 | $2,011 | $176,276 | $37,641 | $138,635 |
| 2020 | $1,990 | $174,470 | $37,256 | $137,214 |
| 2019 | $1,955 | $171,050 | $36,526 | $134,524 |
| 2018 | $1,923 | $167,697 | $35,810 | $131,887 |
| 2017 | $1,886 | $164,409 | $35,108 | $129,301 |
| 2016 | $1,850 | $161,186 | $34,420 | $126,766 |
| 2014 | $1,808 | $155,656 | $33,239 | $122,417 |
T
Seller's Agent in 2026
Thomas Hinkens
Hinkens Group Properties
(805) 757-3799
47 in this area
77 Total Sales
J
Buyer's Agent in 2026
Jose Montes
LPT REALTY, INC
(805) 717-2160
178 in this area
273 Total Sales
Source: North Santa Barbara County Regional MLS
MLS Number: 25002373
APN: 091-250-021
Disclaimer: Certain information contained herein is derived from information provided by parties other than Homes.com. All information provided is deemed reliable, but is not guaranteed to be accurate and should be independently verified.
![]() IDX information is provided exclusively for personal, non-commercial use, and may not be used for any purpose other than to identify prospective properties consumers may be interested in purchasing. Information is deemed reliable but not guaranteed.
IDX information is provided exclusively for personal, non-commercial use, and may not be used for any purpose other than to identify prospective properties consumers may be interested in purchasing. Information is deemed reliable but not guaranteed.
Ask me questions while you tour the home.