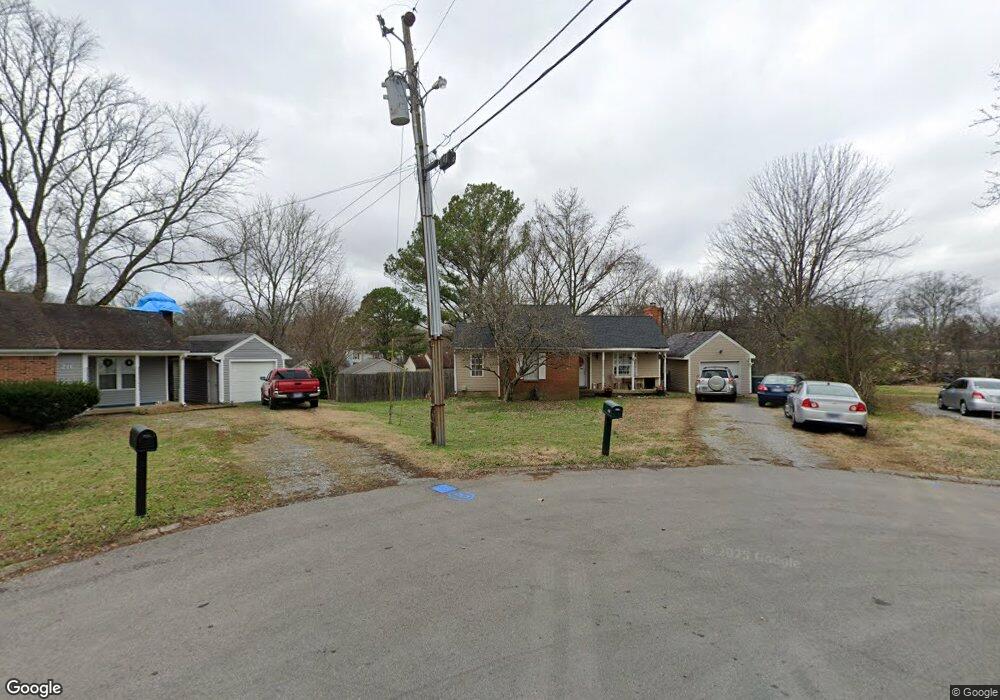
209 Summer Place Mount Juliet, TN 37122
Estimated Value: $289,263 - $361,000
--
Bed
3
Baths
1,346
Sq Ft
$240/Sq Ft
Est. Value
About This Home
This home is located at 209 Summer Place, Mount Juliet, TN 37122 and is currently estimated at $323,566, approximately $240 per square foot. 209 Summer Place is a home located in Wilson County with nearby schools including Rutland Elementary School, Gladeville Middle School, and Wilson Central High School.
Ownership History
Date
Name
Owned For
Owner Type
Purchase Details
Closed on
Feb 29, 2008
Sold by
Uphoff Janet D
Bought by
Mcfarlandand Jeff M
Current Estimated Value
Home Financials for this Owner
Home Financials are based on the most recent Mortgage that was taken out on this home.
Original Mortgage
$141,775
Outstanding Balance
$87,801
Interest Rate
5.63%
Estimated Equity
$235,765
Purchase Details
Closed on
Apr 4, 2005
Sold by
Brad Uphoff
Bought by
Doug Uphoff
Home Financials for this Owner
Home Financials are based on the most recent Mortgage that was taken out on this home.
Original Mortgage
$83,700
Interest Rate
5.74%
Purchase Details
Closed on
Mar 30, 2000
Sold by
Etal Bowling Mary
Bought by
Brad Uphoff
Purchase Details
Closed on
Nov 26, 1991
Bought by
Bowling Mary
Purchase Details
Closed on
Jul 30, 1990
Bought by
Cole Donna L
Purchase Details
Closed on
Mar 12, 1987
Bought by
Keifer Randall Scott
Purchase Details
Closed on
Jan 23, 1985
Bought by
Rueger Jeffrey
Create a Home Valuation Report for This Property
The Home Valuation Report is an in-depth analysis detailing your home's value as well as a comparison with similar homes in the area
Home Values in the Area
Average Home Value in this Area
Purchase History
| Date | Buyer | Sale Price | Title Company |
|---|---|---|---|
| Mcfarlandand Jeff M | $144,000 | -- | |
| Doug Uphoff | $93,000 | -- | |
| Brad Uphoff | $72,000 | -- | |
| Bowling Mary | $60,600 | -- | |
| Cole Donna L | -- | -- | |
| Keifer Randall Scott | -- | -- | |
| Rueger Jeffrey | -- | -- |
Source: Public Records
Mortgage History
| Date | Status | Borrower | Loan Amount |
|---|---|---|---|
| Open | Rueger Jeffrey | $141,775 | |
| Previous Owner | Rueger Jeffrey | $83,700 |
Source: Public Records
Tax History Compared to Growth
Tax History
| Year | Tax Paid | Tax Assessment Tax Assessment Total Assessment is a certain percentage of the fair market value that is determined by local assessors to be the total taxable value of land and additions on the property. | Land | Improvement |
|---|---|---|---|---|
| 2024 | $855 | $44,800 | $15,000 | $29,800 |
| 2022 | $855 | $44,800 | $15,000 | $29,800 |
| 2021 | $904 | $44,800 | $15,000 | $29,800 |
| 2020 | $811 | $44,800 | $15,000 | $29,800 |
| 2019 | $100 | $30,200 | $12,500 | $17,700 |
| 2018 | $811 | $30,200 | $12,500 | $17,700 |
| 2017 | $811 | $30,200 | $12,500 | $17,700 |
| 2016 | $811 | $30,200 | $12,500 | $17,700 |
| 2015 | $837 | $30,200 | $12,500 | $17,700 |
| 2014 | $759 | $27,398 | $0 | $0 |
Source: Public Records
Map
Nearby Homes
- 282 Killian Way
- 268 Killian Way
- 220 Old Towne Dr
- 537 Millwood Ln
- 602 Brigadier St
- 343 Belinda Pkwy
- 532 Millwood Ln
- 226 Sterling Woods Dr
- 120 Southern Way Blvd
- 431 Waterbrook Dr
- 112 Crosby Dr
- Finley Plan at Bradshaw Farms - Cottages
- Harrison Plan at Bradshaw Farms - Cottages
- Chadwick Plan at Bradshaw Farms - Cottages
- Amberbrook Plan at Bradshaw Farms - Cottages
- 609 Heritage Dr
- 1154 Bastion Cir
- 1144 Bastion Cir
- 302 Blockade Ln
- 2116 Putnam Ln
- 207 Summer Place
- 211 Summer Place
- 116 Sunnymeade Dr
- 118 Sunnymeade Dr
- 114 Sunnymeade Dr
- 120 Sunnymeade Dr
- 112 Sunnymeade Dr
- 205 Summer Place
- 213 Summer Place
- 309 Deervale Ct
- 110 Sunnymeade Dr
- 122 Sunnymeade Dr
- 108 Sunnymeade Dr
- 217 Summer Place
- 1725 Summer Place
- 106 Sunnymeade Dr
- 124 Sunnymeade Dr
- 203 Greenlawn Ct
- 117 Sunnymeade Dr
- 115 Sunnymeade Dr