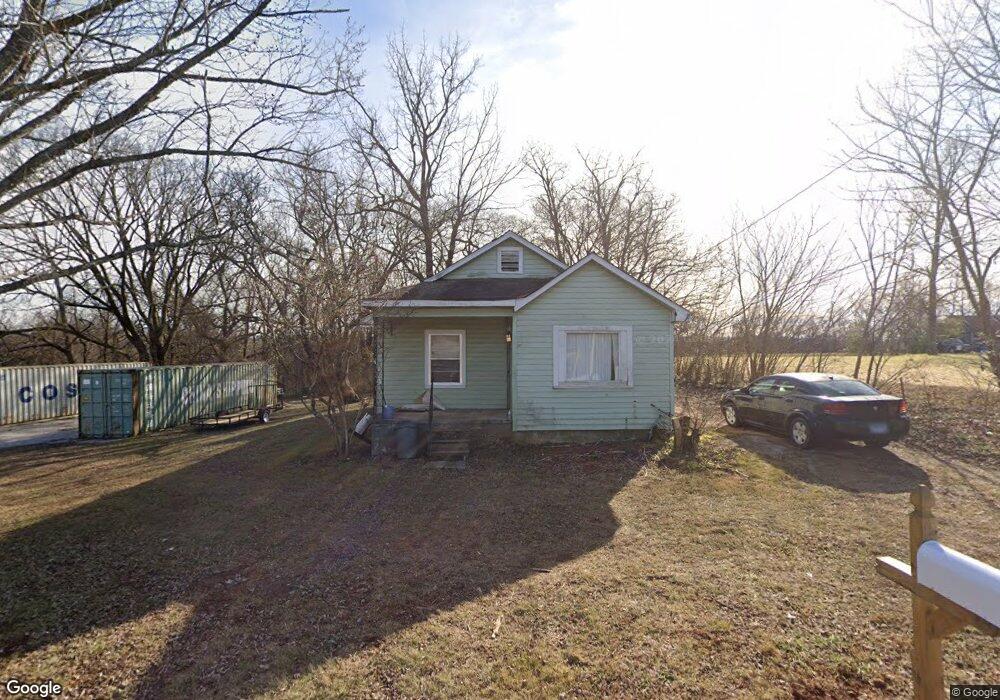
209 Walnut St Decherd, TN 37324
Estimated Value: $105,000 - $188,000
Studio
1
Bath
1,015
Sq Ft
$130/Sq Ft
Est. Value
About This Home
This home is located at 209 Walnut St, Decherd, TN 37324 and is currently estimated at $131,787, approximately $129 per square foot. 209 Walnut St is a home located in Franklin County with nearby schools including North Middle School, South Middle School, and Franklin County High School.
Ownership History
Date
Name
Owned For
Owner Type
Purchase Details
Closed on
May 1, 2023
Sold by
Lamb Melissa F
Bought by
Lamb Melissa F
Current Estimated Value
Purchase Details
Closed on
May 28, 2014
Sold by
Lamb Gary T
Bought by
Lamb Gary T
Purchase Details
Closed on
Nov 25, 2003
Sold by
Rigney Myra
Bought by
Lamb Gary T
Purchase Details
Closed on
Sep 24, 2003
Bought by
Lamb Gary T and Lamb Jamie T
Purchase Details
Closed on
Dec 1, 1966
Bought by
Potts James A and Ruby Virginia
Create a Home Valuation Report for This Property
The Home Valuation Report is an in-depth analysis detailing your home's value as well as a comparison with similar homes in the area
Purchase History
| Date | Buyer | Sale Price | Title Company |
|---|---|---|---|
| Lamb Melissa F | $340,600 | None Listed On Document | |
| Crist Kristen | -- | None Listed On Document | |
| Lamb Gary T | -- | -- | |
| Lamb Gary T | $32,500 | -- | |
| Lamb Gary T | $32,500 | -- | |
| Potts James A | -- | -- |
Source: Public Records
Tax History
| Year | Tax Paid | Tax Assessment Tax Assessment Total Assessment is a certain percentage of the fair market value that is determined by local assessors to be the total taxable value of land and additions on the property. | Land | Improvement |
|---|---|---|---|---|
| 2025 | -- | $25,475 | $11,625 | $13,850 |
| 2024 | -- | $25,475 | $11,625 | $13,850 |
| 2023 | $702 | $25,475 | $11,625 | $13,850 |
| 2022 | $663 | $25,475 | $11,625 | $13,850 |
| 2021 | $386 | $25,475 | $11,625 | $13,850 |
| 2020 | $552 | $13,775 | $7,200 | $6,575 |
| 2019 | $552 | $13,775 | $7,200 | $6,575 |
| 2018 | $524 | $13,775 | $7,200 | $6,575 |
| 2017 | $524 | $13,775 | $7,200 | $6,575 |
| 2016 | $489 | $12,850 | $7,200 | $5,650 |
| 2015 | $489 | $12,850 | $7,200 | $5,650 |
| 2014 | $489 | $12,841 | $0 | $0 |
Source: Public Records
Map
Nearby Homes
- 206 Hotel St
- 202 W Main St
- 0 Ash St
- 106 5th Ave N
- 501 W Broad St
- 203 5th Ave N
- 207 Powell St
- 502 E Market St
- 404 Horton St
- 306 College St
- 404 8th Ave N
- 201 10th Ave N
- 909 Cumberland St Unit 911
- 0 N Bratton St
- 62 Modena Place
- 1105 Cumberland St Unit 1107
- 157 Modena Cir
- 141 Modena Cir
- 44 Flint Dr
- 105 Lakeview Dr